Manager Overload · Manager Bottlenecks · Workflow Bottlenecks
Manager engagement fell to 22%. Why managers are falling apart.
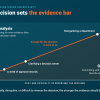
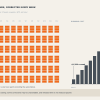
Global manager engagement fell from 31% to 22% in three years while engagement among non-managers stayed nearly flat. Before treating that as a resilience problem, look at what the organization has routed through the role.
Executive SummaryWhat changed for managers, and what to trace first.+
Gallup's 2026 State of the Global Workplace puts global manager engagement at 22% for 2025, down from 31% in 2022. Non-manager engagement moved one point over the same period. Managers account for most of the global decline, and the engagement premium they held over their teams has closed. People in leadership roles also report more daily stress, anger, sadness and loneliness than individual contributors.
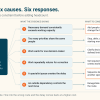
Three jobs were added to the manager role since 2022 and nothing was removed. Management layers came out and the decisions stayed, so approvals and exceptions queue behind whoever is left. AI raised individual output, and the extra volume waits at the review and approval gates managers hold. AI adoption itself was assigned to managers, with no hours attached, while their teams bring them the fear of being replaced.
This is not a manager defect. In Gallup's best-practice organizations, 79% of managers are engaged in the same role, and engaged managers report fewer bad days than the people they lead. Training and coaching help a manager handle what reaches her and do not change what reaches her. Survey data cannot say how much of the drop is routing and how much is the labor market, pay or unease about AI. Those only separate in one priority's record.
Before treating the manager or the route as the cause, check the priority itself: outcome, priority status, capability, authority, external dependency. If those hold and the work still waited, trace one stalled priority that keeps landing on the same manager, mark what actually required her, change one routing condition for 14 days, and measure approval age and reopened work rather than the engagement score. The queue is one way execution drag reaches a result, and the record measures it. Whether it also wore down her judgment is the second way, and it needs evidence of its own.
The usual first step is a $1,500, 90-minute Stalled Priority Snapshot. We reconstruct one priority's route, separate what required the manager from what merely reached her, and design one 14-day routing experiment with the rejection condition written down in advance. If the same manager is on every route, the readout says so.
Tuesday looks like this.
Two approvals from last week are still open because the requests came in without the numbers she needs. A proposal draft that used to take a specialist three days now arrives in an hour, and four of them arrived this morning, each polished, each needing a decision. Her own deliverable, the one on the leadership slide, is due Thursday. Nine people want fifteen minutes. The AI rollout she was told to champion has a training module she has not opened. A skip-level wants to know why the team's engagement score dropped.
By Friday the approvals are still open, the deliverable shipped late, and the module is still unopened. From above it looks like a manager who is not keeping up. From inside the week, everything routed to her and nothing routed away.
That week is what manager overload looks like from inside: more decisions, more people and more change routed through the same role, with no corresponding reduction in the manager's existing work.
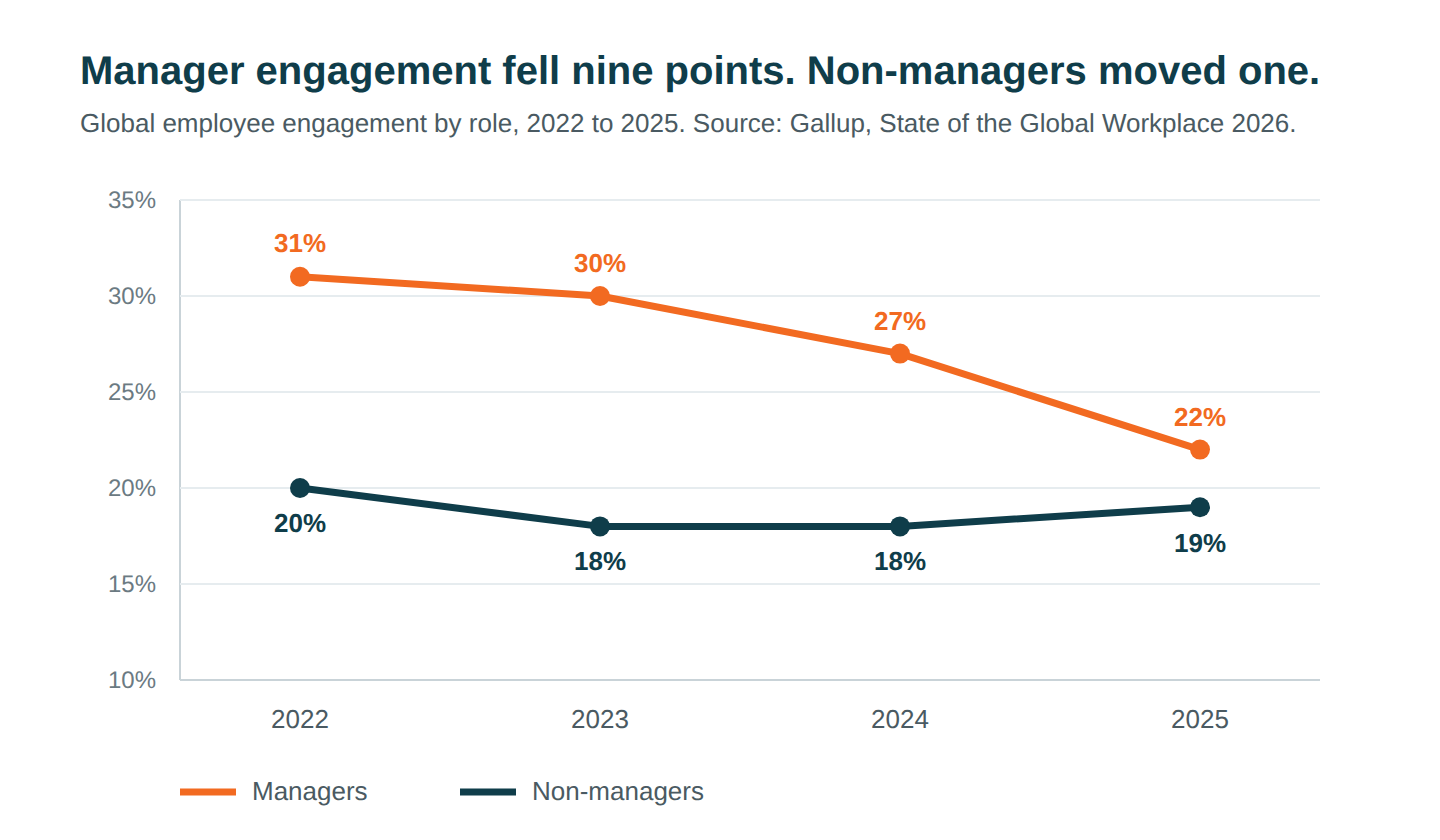
Manager engagement fell nine points
Gallup's State of the Global Workplace 2026 puts global manager engagement at 22% for 2025. In 2022 it was 31%.
| Year | Managers engaged | Non-managers engaged |
|---|---|---|
| 2022 | 31% | 20% |
| 2023 | 30% | 18% |
| 2024 | 27% | 18% |
| 2025 | 22% | 19% |
Read the two columns together. Non-managers moved one point in three years. Managers lost nine, five of them in the last year alone. Gallup says lower engagement among managers accounts for most of the global decline, and that the "engagement premium" managers used to hold over the people they lead has effectively closed. Managers are now about as engaged as their teams.
The daily experience matches. Compared with individual contributors, people in leadership roles were more likely to report a lot of stress the previous day (+7 points). The gaps were wider for anger (+12), sadness (+11) and loneliness (+10). They were less likely than individual contributors to say they smiled or laughed a lot.
Engagement is Gallup's measure. It reads the manager's attachment to the work and the workplace, and Gallup's meta-analyses have repeatedly linked it to team productivity. It is not a diagnosis. It tells you something changed. It does not tell you what.
Manager engagement is not a manager problem
Two findings in the same report make "managers are not built for this" a hard position to hold.
First, in organizations Gallup classifies as best-practice, 79% of managers were engaged in 2025. Nearly four times the global rate, across regions and industries, in the same role under different conditions.
Second, when managers are engaged, they report every negative daily emotion at lower rates than individual contributors, and they are 14 points more likely to be thriving than the average leader. The role does not carry the bad days by itself. The conditions around the role do.
That leaves a different question: what was added to the route through managers between 2022 and 2025, and what came off it.
Why manager engagement is falling: three jobs were added, none removed
1. Layers came out. The decisions stayed.
The span of control story is already on this site: the average U.S. manager now oversees 12.1 direct reports, and 97% of managers carry individual contributor work alongside the team. Read Span of Control: 97% of Managers Are Doing Two Jobs.
Gallup's global data shows the same mechanism at scale. South Asia posted the largest regional drop in manager engagement in 2025, eight points, and the share of workers who are managers fell at the same time. Gallup's reading: employers are cutting management roles, teams are getting larger, and its own span-of-control research finds manager engagement declines as spans widen.
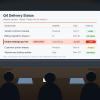
A layer removed is not a decision removed. The approvals, exceptions and escalations that used to clear at that layer now queue behind whoever is left, in line behind that person's own deliverables. A workflow bottleneck with one name on it. That queue is what bottleneck analysis is for, and manager bottlenecks are one of the eight causes of project failure that leave timestamps on the route.
2. AI raised the volume upstream
Among U.S. workers in organizations that have implemented AI, 65% say it has improved their individual productivity. Only 12% strongly agree it has transformed how work gets done in their organization.
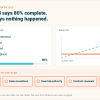
Gallup calls this a disconnect. Operationally, it is a routing outcome. When individual output rises and organizational output does not, the difference is sitting somewhere. In knowledge work it sits at the human judgment gates: review, approval, exception handling. Most of those gates have a manager's name on them. The innovation version of this is already written up.
The proposal that took three days now takes an hour. It still takes the same manager the same twenty minutes to decide whether it is any good, and there are four of them now instead of one.
3. A new job arrived with no hours attached
Gallup's Q1 2026 U.S. data identifies manager-led adoption as one of the two strongest drivers of frequent AI use. When employees strongly agree their manager actively supports the team's use of AI, 79% use it frequently. When they do not, 46%. Employees with that support are 8.7 times as likely to say AI has transformed how work gets done in their organization.
Fewer than a third of U.S. employees in organizations implementing AI strongly agree their manager actively supports the team's use of it. In Germany, 21%.
That gap is usually read as a manager attitude problem. Look at the Tuesday above. Championing a tool means learning it, changing how the team works and checking what it produces, which is a job in its own right, and it was handed to a person already running a fourteen-person team with a deliverable due Thursday. Nothing came off the desk to make room for it.
The same manager is fielding the fear. Gallup finds 18% of U.S. employees now consider it likely their job will be eliminated by technology within five years, 23% in organizations that have implemented AI, and above 30% in finance, insurance and technology. Those conversations route to the manager too.
None of this is the whole explanation, and survey data cannot make it one. Gallup can show that manager engagement fell, and that it fell fastest where management layers thinned. It cannot say how much of the drop is routing, how much is a labor market where leaving stopped being an option, and how much is pay, return-to-office friction or plain unease about AI. All of those pull on the same number. They only come apart in one priority's record, where the waits have dates on them.
Manager overload is not solved by training alone
Gallup's response leans toward manager training and coaching, and the evidence for it is real. Gallup reports its coaching programs raised both manager and team engagement, with effects that held for months after the program ended. That is worth doing, but it cannot carry the full response to manager overload.
It is not where to start. Training improves how a manager handles what reaches her. It does not change what reaches her. A manager coached to run better one-on-ones still has fourteen of them. She still has the two open approvals, the four AI drafts and the Thursday deadline. The queue is a design decision. The coaching is a person decision. Make the design decision first, or the coaching gets spent on the queue.
The same applies to the usual response to an overloaded manager: resilience programs and wellbeing benefits. They help a person recover from the week, and nothing in them decides who owns the decision, removes the redundant approval, or sets the threshold below which the team does not need her. Role ambiguity works the same way.
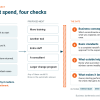
Before treating the manager as the cause, and before treating the route as the cause either, run the five checks that come first:
- The outcome. Is what should have moved still specific, still valid, still required? A priority that stopped mattering is not a routing problem.
- The priority. Do leaders still treat it as a chosen priority, or has it become one person's?
- The capability. Did the people on the route have the skill and the information to move it?
- The authority. Did they have the funding and the authority?
- The dependency. Was progress controlled by something outside the organization: a vendor, a regulator, a customer?
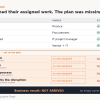
Every no or unknown is a competing explanation, and it goes in the record. If all five hold and the work still waited, the route is the next place to look, and changing the manager will not change the number.
Trace one priority that is waiting on a manager
Start with one stalled priority, not a survey.
- Pick one outcome that should have moved by now and that keeps landing on the same manager. Choose by the escalation trail, not by the engagement score.
- Rebuild the route from records. Tickets, approval history, message threads. Mark every point where the priority waited for that manager, returned to her, or was reopened after she cleared it.
- Mark what required her. For each stop: could it have cleared at a threshold, a rule, or one level down? What was missing when it arrived that forced a second trip?
- Look at what else was in her queue that week. Her own deliverable, the meetings she was required in, the AI output she was asked to check. Gallup's warning line is 40% IC time. Above it, engagement falls, and it falls further as the team grows.
- Write the rejection condition before you change anything. If the priority does not move and approval age does not drop, the route was not the explanation, and you go back to the five checks.
- Change one condition for 14 days. Give routine approvals a band she does not see. Require one field at intake. Move one class of exception to a named owner.
- Measure close to the queue. Elapsed time on the priority. Age of the oldest open approval. Reopened work. Leave the engagement score out of it. That number moves last.
If the same manager turns up on the next priority you trace, and the one after that, the finding has moved from the priority to the route.
What this means for you
If you are a manager
- Count what reached you last week. Write the number down. It is probably higher than anyone above you thinks.
- Sort it: required you, could have cleared elsewhere, arrived incomplete.
- Bring the sorted list, and the one priority that has waited on you longest, to your leader. A list is an operating fact. A feeling of being behind turns into a performance conversation.
If you are a leader
- Before the next flattening, name what the layer clears. Decide where each decision goes. Otherwise it goes to whoever is left.
- Do not assign AI adoption to managers without removing something. A job with no hours attached does not get done, and the adoption number will say so.
- Gallup has found managers account for about 70% of the variance in team engagement. The team number follows the manager number. Before you read the team numbers by manager, trace one priority that is waiting on that manager and see what the route says.
What manager overload looks like in the work record
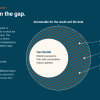
The managers who lost nine points did not lose skill. The judgment, the coaching and the attention that made them worth promoting are still there. The route through them spends those things before they reach the team. That is the Manager Load Tax: judgment consumed by the queue, and it shows up first as approval age and escalation concentration, long before it shows up in a survey.
Those are the two ways execution drag reaches a result, and they need separating in the record. The first is the queue itself: two approvals open because the requests arrived without the numbers, four drafts waiting for a decision, exceptions that used to clear a layer down. The work waits at her desk whether or not her judgment has changed. Approval age and reopened work measure that directly.
The second is what the queue does to the person clearing it. Fourteen one-on-ones, four decisions in a morning and a deliverable due Thursday add demand, and that demand can make judgment and focus harder to use consistently. That is the tax, and it is the harder one to prove. The approval history shows the wait. It does not show whether the decisions she made under it were worse. That needs evidence of its own: a reopened approval, a reversed decision, a draft cleared that should have come back. Fix the routing first. The queue is measurable now, and it is the part that changes what reaches her.
Gallup's best-practice organizations show that the same role can produce a very different engagement result under different operating conditions. The work record is where you test which conditions matter locally.
Bring the priority that is waiting on your busiest manager.
In a $1,500, 90-minute Stalled Priority Snapshot, we reconstruct that priority's actual route, separate what required the manager from what merely reached her, and design one 14-day routing change with an owner, a measure and the result that would prove the diagnosis wrong. If the same manager is on every route, the readout says so.
Manager engagement: common questions
Why is manager engagement declining?
Gallup's 2026 data shows manager engagement fell from 31% in 2022 to 22% in 2025, the largest drop of any group, while non-managers held near 19%. Gallup ties part of the decline to thinning management layers and wider spans of control. The argument above is that the mechanism is routing: more decisions, more people and more change moving through the same role, with nothing taken off it.
How many direct reports is too many for a manager?
Gallup's U.S. study puts the average span at 12.1 direct reports and finds engagement declines as spans widen, particularly once a manager spends more than about 40% of the week on individual contributor work. There is no single ceiling. The number that matters is how many decisions reach the manager each week and how many of them could have cleared somewhere else.
Is manager overload a performance problem?
Not by default. In Gallup's best-practice organizations, 79% of managers are engaged in the same role. Before reading overload as performance, check the five conditions above, then trace one priority that keeps landing on the manager and see whether it waited on decisions that could have cleared at a threshold, a rule, or one level down.
Sources
- Gallup. (2026). State of the Global Workplace: 2026 Report. Gallup, Inc. Manager and non-manager engagement by year, best-practice manager engagement, daily emotions by role, South Asia manager trend, U.S. AI adoption and job-elimination findings.
- Gallup. Span of Control: What's the Optimal Team Size for Managers? Average span, IC workload share and the 40% threshold.
- Gallup. State of the American Manager. Manager share of variance in team engagement.
- Gallup. Q12 Meta-Analysis Report. Relationship between engagement and business-unit productivity.