Operational Payoff · Operations consulting
Why Projects Fail: 8 Causes and What to Check First
Why do projects fail? There isn't one answer. Some were the wrong projects to approve. Some were given a deadline, budget, or scope that never made sense. Others had a sound premise and capable people, and slipped anyway because a decision sat unresolved or a dependency nobody controlled held the date.
The warning signs look ordinary
- A date moves.
- A dependency stays open through another reporting cycle.
- Finished work comes back for review.
- A rollout reaches some locations while others wait.
- A new process launches on time and people keep using the old one.
What you have now
A list of causes
Tells you what can go wrong.
The status report
Tells you it's late.
The team's own post-mortem
Can identify causes and lessons.
A workflow assessment
Traces the workflow.
A useful investigation shouldn’t stop at the first plausible explanation. We check the project, the work that had to exist, where the work got stuck, the conditions around execution, and other explanations the evidence supports.
How Emergent Skills investigates
- Checks the project itself first
- Checks whether the work needed for the result was ever assigned
- Traces the work path
- Checks whether work demands contribute to errors and rework
If the answer is a staffing, funding, dependency, business-case, or other question rather than one of those areas, we say so. We test competing explanations against the work and the evidence, state what remains uncertain, and give the result owner a written assessment to act on.
Led by Jim Wilde, founder of Emergent Skills. Nine years as lead consultant on mta.info and the NYC subway countdown clocks. Decades in enterprise systems before that.
Where project failure begins
Eight common reasons why projects fail
These conditions show up first as project delays, well before anyone calls the project a failure. They range from competing priorities and slow decisions to missed handoffs, rework, manager bottlenecks, and conditions that changed after approval. Each card ends with what to look for in the record.
We begin with what can be dated. A decision entered a queue on Tuesday and cleared twelve days later. A deliverable came back after approval. Three projects reached the same specialist in the same week. Starting there keeps the analysis tied to the work record and keeps the first conversation from becoming a search for somebody to blame. The grouping says nothing about fault; the result owner may end up owning the fix even when the first symptom appeared somewhere else.
1. The project is approved before it is understood
Approval comes before the outcome, requirements, benefits, delivery route, and constraints are understood well enough to support the commitment. The project then has to discover what it is while the clock is already running.
Observe: repeated discovery, missing requirements, unresolved assumptions, early re-baselining.
2. Competing priorities create capacity constraints
Shared people and resources are spread across more work than the system can finish. Work in progress climbs, and each new commitment borrows capacity from something already underway.
Observe: starts exceed finishes, priorities change constantly, milestones all move right together.
3. Decision bottlenecks form
Sometimes nobody is sure who decides. Sometimes the decider is known, but several people can stop the choice, or it waits for a meeting held every other week. Any of those turns a small decision into a schedule constraint.
Observe: aging decision log, repeated discussion of settled questions, postponed approvals, reversals.
4. Missed handoffs and dependencies create queues
Progress reaches another team, system, or approval and sits. The wait may be for a vendor, a specialist, or a missing piece of information. Often the handoff has no owner, no acceptance rule, and no agreed response time, so follow-up becomes the only control.
Observe: blocked days, handoff count, follow-up touches, queue age.
5. Rework returns completed work to the queue
A reviewer arrives late, the definition of done shifts, or a requirement that should have been settled at the start appears after delivery. The team does the work again, using capacity already committed to the next step.
Observe: revision count, reopened tasks, repeated review, late defects, a definition of done that moved.
6. Manager bottlenecks constrain the critical route
Difficult decisions, approvals, and rescue work keep finding the same manager, expert, or decision owner. Cross, Rebele, and Grant studied more than 300 organizations and found that 3% to 5% of employees accounted for 20% to 35% of value-adding collaboration. The people an organization relies on most become the people everyone waits for. Collaborative Overload
Observe: approval concentration, rescue work, escalations, after-hours intervention.
7. Leadership backing weakens or adoption meets barriers
The leader responsible for the result may lack the authority or involvement to protect the priority and settle tradeoffs. Adoption can also fall short after a well-supported launch: users are waiting for access or information, need training, face conflicting incentives, or find the new process doesn't fit the work. Trace one attempt to use it before choosing a response.
Observe: unresolved tradeoffs, eligible users waiting for access, incomplete first uses, workarounds, and old and new processes running in parallel.
8. Conditions change but the plan does not
Technology, regulation, customer requirements, leadership, or strategy moved after approval. The schedule has been updated several times, and nobody stopped to replan the work from the new reality.
Observe: schedule revisions with no scope decision, hidden work, assumptions nobody has revisited.
The causes rarely stay separate for long. An unclear requirement sends completed work back to an expert who is already supporting several priorities. The wait for that expert triggers escalation, the escalation adds meetings and another approval, and a project that began with an ordinary specification problem now has a much longer route.
The method should match the question. A gap analysis defines the distance between the intended result and the current one. Bottleneck analysis identifies the constraint setting the pace. Root cause analysis is the better question when the constraint is known and you need to learn what created or sustains it. In each case the project record has to supply the evidence.
What a focused outside investigation adds
You've lived with the project for months and can recite each team's explanation. What you don't have is how those accounts fit together: what happened between functions, which version the records support, and what decision would move the result. An outside investigation can also give the result owner an independent finding to take across teams when the explanation itself has become disputed or politically difficult.
A work-path finding stands on its own. ES also investigates whether conditions around the work are contributing to errors, reversals, and rework. We assess that explanation against the Four Tests below and check competing explanations. The readout separates what's supported from what still needs testing. There is no phase two waiting behind the finding.
Initial Investigation Checks

Check the project before blaming the route
Some projects are compromised before execution begins. Harvard Business Review identifies five broad failure conditions: the wrong project, unrealistic constraints, ineffective leadership, excessive complexity, and basic project-management failures. A route analysis cannot rescue a project that should not proceed or one that was never given what success requires.
1. Outcome validity
Is the result still worth pursuing?
2. Priority choice
Is it genuinely a chosen priority?
3. Delivery prerequisites
Are capability, information, authority, and funding available?
4. External dependency
Is something outside the organization controlling progress?
Sometimes these checks settle the next action on their own: the result owner has to settle the intended result, resolve competing commitments, or supply a missing resource. A problem here doesn't rule out either route. If the trace is warranted, it starts here.
Check whether necessary work has an owner
Work that may be missing from the plan includes: making the new thing work with this company's data and exceptions, getting the teams it touches to agree on handoffs, switching off the old process, and settling who absorbs the cost of the change. Check which work is needed, who owns it, and whether an assignment gap contributed to the shortfall.
The Work Nobody Is Assigned To walks through the four jobs and how to check for missing work.
Testing the conditions around the work
The Four Tests
Are working conditions adding errors? A work-path finding stands on its own. These tests examine whether the conditions around the work are also affecting how reliably capable people perform.
1. Baseline shift
Are people performing below a level they sustained over time?
A peak held through unsustainable effort is not the baseline.
2. Load signature
Do errors, reversals, delays, or rework cluster under identifiable demand conditions?
3. Shared conditions
Do multiple capable people under the same operating conditions show the pattern?
4. Reversibility
When those conditions change, do the agreed metric and the error pattern improve without replacing the people?
The first three tests can support a hypothesis. Reversibility tests it. A Snapshot can recommend the test; showing reversibility takes evidence from changed conditions. Better flow alone doesn't prove conditions were the cause, since a change can improve the work path directly and other changes may explain the result.
Three situations to examine
Stalled, partly delivered, or launched but underused?
Stalled: a decision, milestone, or deliverable has not arrived. Trace its reviews and handoffs, including anything that came back.
Partly delivered: some teams or locations have the result while others are still waiting. Choose one missing part and trace what it needs to move next.
Launched but underused: the new process or system is available, but use falls short of the agreed target at the review date. Trace one attempt to make the switch, including access, information, approvals, and any return to the old way.
The result owner names the shortfall and judges the business benefit. Low adoption alone does not establish a cause.
Read the examples: project delays, partial delivery, and low adoption.
Flow efficiency and the cost of waiting
Flow efficiency: separate work from waiting
Measure route time and labor time separately. Convert active and elapsed route time to the same unit before calculating flow efficiency.
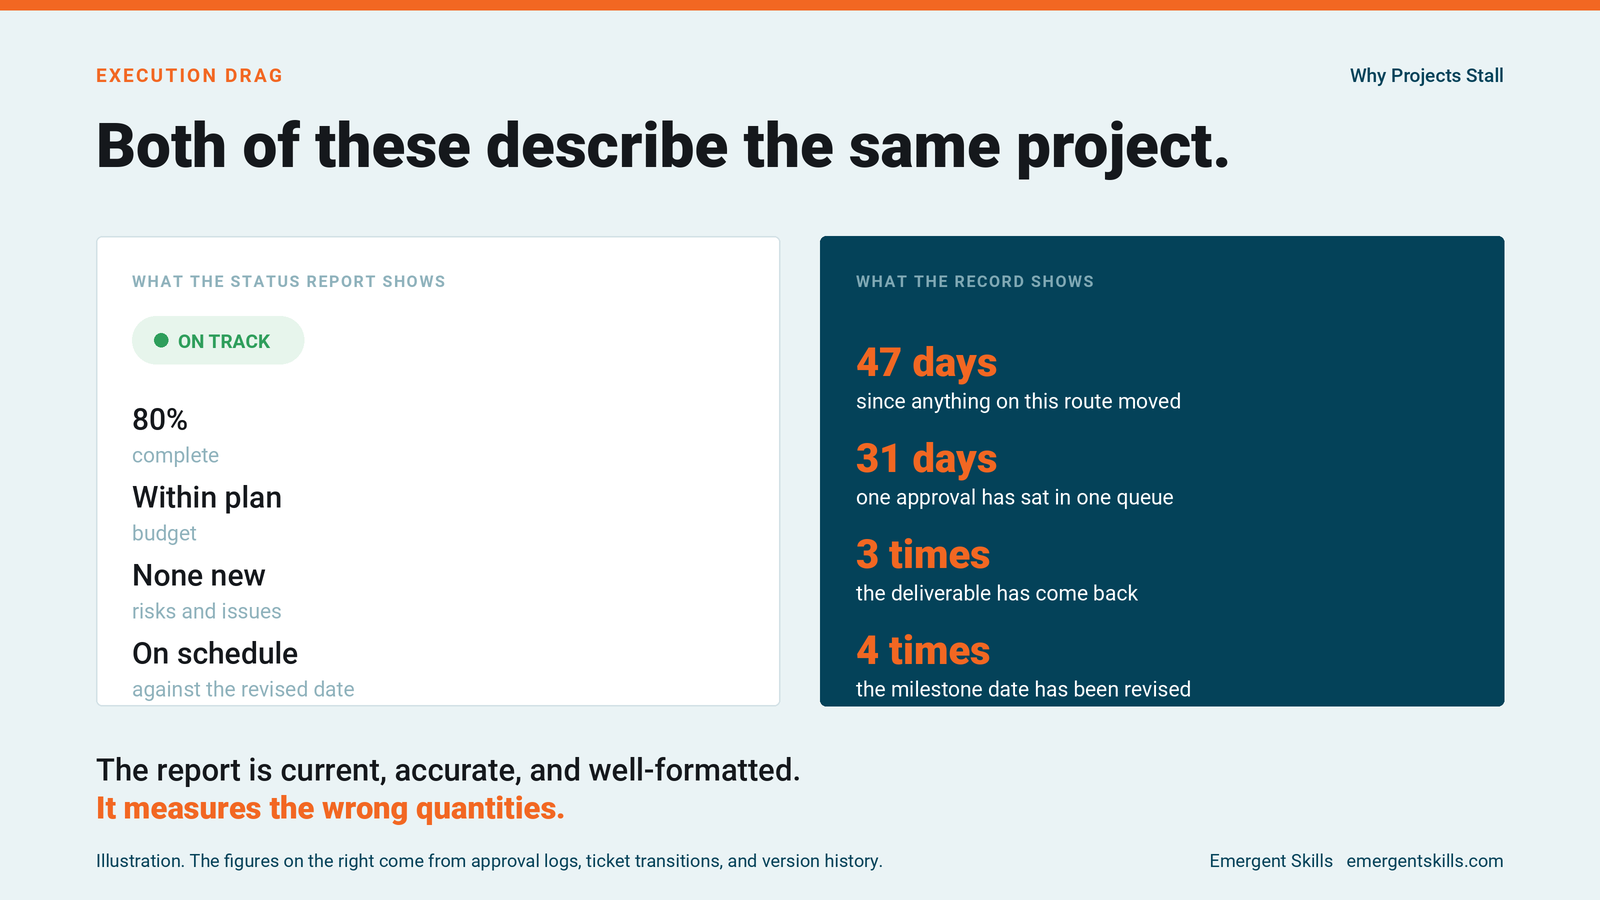
A failing project can have a perfectly current status report. Dashboards are good at activity, status, and deadlines. To understand the shortfall, check how long a decisive approval sat untouched, how often finished work reopened, and whether the same dependency has controlled three successive dates. At the system level, why execution stalls covers how those patterns spread across an operation. Here the question is narrower: how long has this outcome been waiting, and what held it there?
What reports show
- Percentage complete
- Tasks completed
- Budget consumed
- Milestones
- Red, amber, or green status
- Risks and issues
What else to check
- Percentage of elapsed time spent waiting
- Age of unresolved decisions and dependencies
- Number of reopenings, and whether the definition of done moved
- Approval concentration
- Work in progress competing for the same people
- Whether the next milestone has a clear route to completion

A project can sit at 80% complete for months and still look busy, because tasks keep closing. The last 20% holds the integration, the acceptance decision, or the dependency the whole outcome rests on. Percentage complete can't tell the difference.
Take one delayed result and reconstruct its route from dates, revision histories, and decision logs. Where the evidence supports it, compare active time with total elapsed time on the same route, in the same unit, counting overlapping active intervals once. Route touch time is different from the combined person-hours of everyone involved. The resulting percentage is flow efficiency. Dated handoffs alone can establish a wait without establishing how much active time sat between them. An adoption review starts differently, by tracing the steps needed to use what launched, and may not need the calculation.
Consider a route with one day of touch work spread across five elapsed days. Even if every touch hour vanished, the finish date could improve by only one day unless something also changed the four days of waiting. No benchmark is needed to make that point.
More hands or faster work can reduce resource queues, but they won’t resolve every kind of wait. A fixed approval meeting or an external dependency needs a different response. Flow efficiency shows the share of time spent active; the route trace shows where the time went and what might change it.
When one step holds most of the elapsed time, look inside that interval. Approval cadence, shared-resource queues, priority competition, batching, and external dependencies are the usual explanations to check against the record. If active time can't be reconstructed reliably, we leave flow efficiency uncalculated and say what to record next; the dated waits, handoffs, and reopenings may still support a decision.
One more thing flow efficiency can't tell you. A long wait that runs alongside other work may never touch the finish date. Halve it and the chart improves while the outcome stays put. The trace is where we sort that out.
Time lost and labor consumed
Time and labor behind the shortfall
One result's record can support two numbers: extra labor and elapsed delay. We report each where the evidence supports it, with the assumptions visible.
One: the hours you can defend
Start with meetings called because the result was stuck, including everyone pulled into them. Add context rebuilding after a handoff or reopening, escalation calls, and rework tied to the result. Calendars and revision histories locate the effort; participants confirm what it involved. Use a range when the hours are estimated.
Countable from: calendar entries, meeting logs, revision history, escalation threads.
Two: the elapsed delay, reported separately
Waiting is reported separately from person-hours. It is established from the dated sequence of work, decisions, handoffs, and reopenings, never by subtracting labor hours from calendar time. We don't put a dollar value on those days unless the client supplies a defensible assumption about the benefit the finished project would have delivered. The record establishes the delay; it can't establish the value on its own.
Countable from: dated waiting intervals in decision logs, handoff records, calendars, revision histories, and escalation threads.
The same shortfall across several results is a different question and needs a wider evidence base. That's the Work Demand Diagnostic, not the Snapshot.
How many projects fail?
Project success includes value, as well as delivery
Late, partly delivered, underused, and unsuccessful on value are different questions. To use a research finding responsibly, keep the measure and the study year attached to it.
In its 2024 research announcement, the Project Management Institute reported that 48% of projects were considered successful when judged by whether the value delivered justified the effort and expense. Another 40% fell between success and failure, while 12% were considered outright failures.
Those findings describe judgments of project value. They don't say how many projects stalled, hit a routing problem, or would benefit from a Snapshot. For a particular project, the practical starting point is the gap between the result expected and the result achieved.
Bring the one that's still waiting.
One delayed milestone, undelivered part of a rollout, or adoption shortfall, and the record behind it. The Stalled Priority Snapshot returns a work-path map, an evidence assessment of necessary work, the work path, conditions around execution, and competing explanations, plus one recommended next step within 24 hours, with a 15-minute walkthrough and a follow-up after any agreed test. $1,500 USD, fixed. No commitment past that.
If a similar shortfall shows up across several priorities and the evidence points to competing priorities, manager overload, or work demand, the Work Demand Diagnostic may be the next step.
You can upload a PO or request a quote with your Snapshot request. Purchasing and the session date are confirmed separately.
