Operational Payoff - Operations consulting.  Find out what's wrong.
  Know before you commit.
The result is falling short.
You're the one explaining why.
Another status meeting. Different explanations from each team. You still need to decide what happens next.
Emergent Skills is an operations consulting firm that investigates why projects stall, results fall short, and problems keep coming back.
When a project stalls or a result falls short, people often already have explanations: the process, the people, training, priorities, workload, the system, or something else. Any one could be right. We test those explanations against the work and the evidence.
Before you fund the fix, find the right problem.
Start with one important result through the  Priority Snapshot to find out what's wrong. Within 24 hours of the 90-minute session, you get what the evidence supports, what remains uncertain, the costs we can establish, and the next step we recommend.
For operations managers, project managers, and division leaders in organizations of any size who are accountable for the business result.
We investigate broadly enough that the first explanation doesn’t become the answer by default. Three places deserve a closer look:
Necessary work
Was all the necessary work identified and assigned?
A project can be delivered as planned and still miss the result because necessary work was omitted or never assigned. We establish what work the result required and who owned it.
Route 1
Where the work gets stuck
Queues, approvals, handoffs, repeated reviews, and rework can keep work from moving cleanly toward the result.
Route 2
What the conditions around the work are doing to execution
Interruptions, switching, and competing decisions may contribute to errors, reversals, rework, or missed handoffs. We test whether that connection appears in the evidence.
One may explain the shortfall. Several may be interacting. Or the evidence may point somewhere else.
We keep other explanations open: the business case, priorities, capability, information, authority, funding, external dependencies, incentives, or basic execution discipline. We look for evidence that could prove an explanation wrong, not just evidence that supports it.
The result is a written finding showing what the evidence supports, what remains uncertain, and what is worth changing. If the evidence points somewhere else, we say so.
Led by Jim Wilde, founder of Emergent Skills. Nine years as lead consultant on mta.info and the NYC subway countdown clocks. Decades in enterprise systems before that.
Priority Snapshot: $1,500 USD fixed · One important result · Optional written input from 6–8 contributors · One 90-minute session, up to 3 people · Readout within 24 hours
 Investigate one priority →
What it looks like before you have a name for it
These patterns show up when leaders ask why projects fail, and when the same operational problems keep coming back. Each one points to a problem. None proves the cause.
The team starts the day in meetings and does the real work after hours.
Every new priority stayed active. Nothing came off.
The team that delivered last quarter is gridlocked this quarter. Same people. Same skills.
The rollout works at headquarters. The branches are still waiting.
Illustrative example: the work itself took four hours. Approval took nineteen days.
A completed deliverable is back for a third review because the criteria arrived late.
The new process launched on time. People still use the old spreadsheet.
The project was delivered. The work needed to make it produce the result was never assigned to anyone.
The handoff was agreed in a meeting in June. Ask who owns it today and you get a department, not a name.
The AI pilot added review and exception work. The old process still runs beside it.
The intake got automated. The request reaches the same reviewer's queue a day sooner and waits there just as long.
The same invoice error is corrected every month. Nobody owns changing the intake rule that produces it.
Urgent work keeps shipping. The strategic initiative that defined the plan is still on the slide.
The budget is spent. The return the business case promised hasn't started.
The customer who asked for it signed with a competitor while it waited for sign-off.
Automating one step may leave approvals, reviews, and queues elsewhere unchanged. That's why a faster step can still leave the overall result late.
Operational bottlenecks can sit in resources, approvals, dependencies, or cross-functional handoffs. Workflow bottlenecks show up as waiting and rework. Slow decision-making can point to unclear authority or an overloaded decision route. We check each, and whether the conditions around the work are adding errors on top.
Stalled, partly delivered, or launched but underused? See the three situations →
For work crossing departments, explore the roles a strategy passes through and why it stalls.
How we investigate
Don’t force the problem to fit the explanation.
We don’t start with the answer. We test the explanations against the work.
A stalled result can come from work that was never assigned, the path the work took, or the conditions around it. It can also come from a resourcing gap, a priority call, a business-fit problem, an outside constraint, or several conditions acting together.
We start with the result and what had to be true for it to succeed. Then we reconstruct what happened, test the competing explanations against the evidence, and look at what the shortfall is costing while it continues.
The point isn’t to prove our model. It’s to find the explanation that survives the evidence - and the smallest change worth testing.
Your other options
Three ways this gets handled. What to consider.
01 Your PMO, operations team, or analysts investigate it
Your PMO, operations team, project manager, or analysts already know the organization and may have the records and systems needed to determine what happened. If they can assemble the evidence, challenge the competing explanations, and recommend a useful next step, an outside investigation may not be necessary. If the explanation remains unclear or disputed, check whether the review covered the result and its prerequisites, necessary work and ownership, the work path, conditions around execution, and other plausible explanations.
02 A consulting firm or operating partner scopes it
An outside consultant, operating partner, or specialist may be the right choice. Compare the question they will investigate, the evidence they will use, the scope, and the decision you need to make. An outside investigation can also help when the issue crosses teams or when the sponsor needs an independent finding they can take back to the organization. The Snapshot covers one important result for $1,500, fixed, with a readout within 24 hours of the session.
03 You wait for it to clear
The status meetings continue. So do the rework, the chasing, and the slipping milestones, and none of it shows up as a line item.
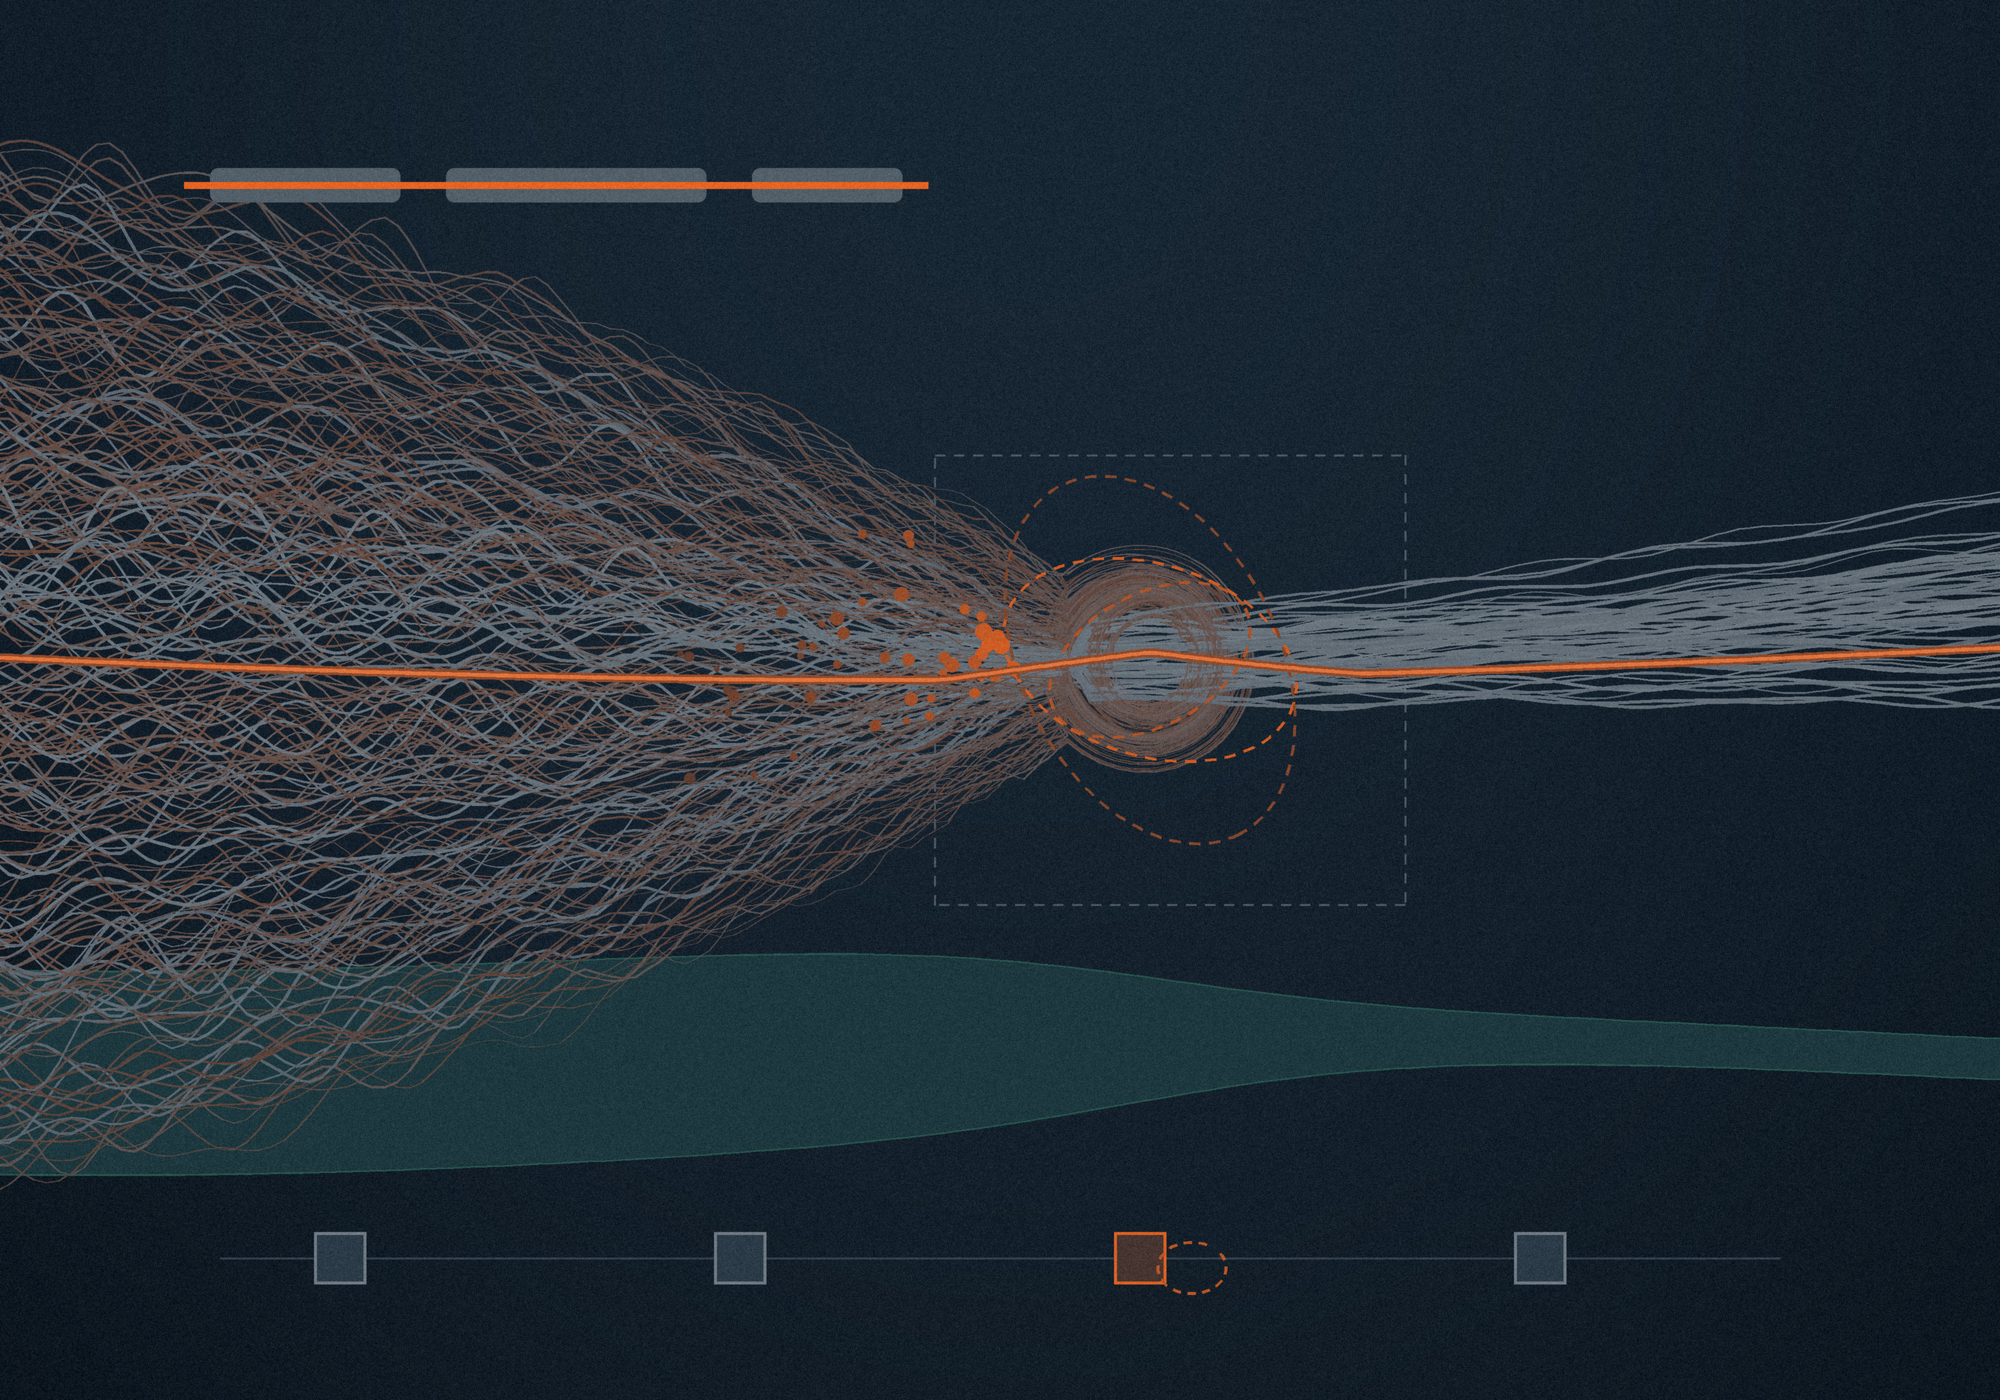
Your systems can provide important evidence. The investigation tests which explanation that evidence actually supports.
What a useful investigation should do
It should start with the result, not a preferred fix. It should test the plausible explanations, follow the evidence, say what can and cannot be established, and leave you with the smallest next move the evidence justifies.
Priority Snapshot -  Find Out What's Wrong
Investigate one result that still matters.
Bring one delayed decision, stalled rollout, or launch that hasn't paid off. We reconstruct what happened, check whether the work needed for the result was ever assigned, test both routes, and check the competing explanations.
The 90 minutes is the working session, not the whole investigation. Written input and records are reviewed around one tightly scoped question: one result, competing explanations, and one next decision.
What you receive
A written readout within 24 hours: a map of the work as far as the evidence supports, whether the work was ever assigned, what each route explains, and one recommended next step. A 15-minute walkthrough helps the result owner review it.
Where the records support it, the readout includes an extra-labor estimate. If a test is justified, its duration, measures, owner, and review point are agreed around the work cycle. Missing evidence becomes a specific question to investigate.
The evidence determines the next step.
We tell you what the evidence supports: necessary work without an owner, the work path, the conditions around execution, or another explanation. If the cause remains unresolved, we identify what evidence or decision is needed next. Every recommendation comes with what backs it and what still needs checking.
See a sample readout before you buy one
Northline is an invented sample, not a client result. It shows the format: the map of the work, what each route explains, the extra-labor estimate with its arithmetic beside it, and the recommended next step. Open the sample readout →
What could change this conclusion?
Every readout names the assumptions behind any cost estimate, the open questions that could change the recommendation, and whether settling them takes more evidence, a management decision, or both.
Follow-up after an agreed test or evidence review is included. No commitment past that.
Decision Challenge - Know Before You Commit
You're about to commit. Is the evidence strong enough?
You're considering a new system, an AI rollout, a reorganization, or the next investment in work already underway. The proposal looks reasonable, but a key assumption about the expected result still needs checking.
What the review examines
We examine the evidence, credible alternatives, costs and downside, and the work required to produce the business result. Decision Challenge focuses on one defined commitment and whether it is justified.
What you receive: a written decision brief
The brief explains what ES recommends, the evidence behind it, what remains uncertain, and what would change the finding. The recommendation may be to proceed, proceed with changes, test before committing, get specific evidence first, or not proceed.
Decision Challenge is a new ES method under evaluation. Its scope, fee, and delivery timing are agreed separately.
After the initial checks, three areas we investigate
Was the work assigned? Where does it get stuck? What makes it harder to get right?
First
The work nobody was given
We check for necessary work that may have been omitted or left unassigned. For implementation and rollout work, useful prompts include making it work with actual data and exceptions, fitting cross-team handoffs, retiring the old process, and settling who absorbs the operating change.
We ask for a name, not a department. A job with no owner is a finding on its own, about assignment, never about a person.
Route 1
The work itself
Queues, handoffs, approvals, and rework can hold up an otherwise capable team.
We trace where delivery is obstructed. A work-path finding stands on its own.
Route 2
The conditions around the work
Interruptions, constant switching, and competing decisions can make it harder to focus, judge, and follow through. We investigate whether those demands are contributing to the shortfall.
We don't assume it. It has to show up in the errors, repeated work, reversals, or missed handoffs. We assess the evidence against four tests. The first three can support a hypothesis. Reversibility requires evidence from changed conditions.
The three can feed each other. Work nobody owns waits, waiting creates chasing, and the chasing adds mistakes that create more waiting.
What the findings help you decide
Which jobs need a named owner, which priorities stay active, who has decision authority, how reviews and handoffs work, and how much demand runs through the same people and decision points.
If none of these areas explains the shortfall, the readout says what remains unresolved and what evidence or decision is needed next. There is no phase two waiting behind the finding.
What the delay costs
The delay is visible. Its full cost may not be.
Illustrative example: four hours of work, nineteen days waiting for approval. Underneath the wait, people may chase the decision, repeat the review, or rebuild context, while a customer delivery or billing milestone can slide with it. The readout sorts the costs the evidence supports so each is counted once, with the arithmetic beside every figure.
How much is at stake? Tie the delay to revenue, a customer delivery, or other work that matters. The remaining value or avoidable future cost needs to justify both the $1,500 fee and your team's time.
One traced result shows what happened once. Whether it keeps happening is the next question.
Common questions about investigations and Decision Challenge
How is Decision Challenge different from the Snapshot?
The Snapshot investigates why a result fell short and what to do next. Decision Challenge examines whether a proposed commitment is justified, including the next investment in work already underway. If that decision depends on an unresolved explanation of past performance, we identify the specific question that needs investigation.
What if the work path is not the problem?
We check four things first: whether the result is still worth pursuing, whether it's a chosen priority, whether capability, information, authority, and funding are in place, and whether something outside the organization is controlling progress. We also check whether the work needed to produce the result was ever assigned to anyone, and we look at the conditions around the work even when work-path evidence is thin. A problem in one of those checks can make a resource or leadership decision the next step. It doesn't rule out either route.
If none of these areas explains the shortfall, the readout names the strongest other explanation the evidence allows, or says the cause is still unclear and what would settle it.
Is this a people program?
No. The Snapshot starts with the business result, the work, and the conditions around it. It does not assess personality or rate employees. If the evidence establishes a capability, conduct, or individual performance issue, we say so without guessing about motives or character.
Could my team do this with AI?
Yes. AI will organize the records and draft the map. The question is whether anyone on your team has the time to run the investigation, and what evidence ends up behind the decision.
With the Snapshot, ES runs the working session, checks each explanation against the records, including evidence that could prove it wrong, and writes the recommendation with its assumptions and limits. If the evidence points elsewhere or remains unresolved, the readout says so. The Snapshot page sets out the scope and what to bring.
We have a PMO and a transformation office. Why bring this in?
Bring it in when one important result remains unresolved after the internal review. The Snapshot is scoped to one result at a fixed fee and remains subject to your organization's purchasing requirements. The readout goes to the result owner, and the PMO or transformation office can own the next step.
Our operating partner already covers portfolio operations.
Operating partners set the value-creation plan and bring in firms for the large workstreams. The Snapshot covers one stalled item inside that plan, in one session, with a readout the operating partner and the portfolio company team can both use. It doesn't replace the plan or the firm.
How much of my team's time does the Snapshot take?
The Snapshot includes one 90-minute session with up to three people. Written input from six to eight contributors is optional; participation and preparation are agreed before booking. The readout arrives within 24 hours of the session.
What happens after the readout?
The Snapshot includes a 15-minute walkthrough with the result owner and follow-up after an agreed test or evidence review. Tests are optional, with timing matched to the work cycle. No further engagement is required.
Which project should I bring?
The one you keep getting asked about: a result that still matters, with enough at stake to justify looking.
What if the finding points at my team or my own decisions?
The readout starts with the work, conditions, routes, and decisions. If the evidence supports a capability, conduct, or individual performance issue, we say so without making unsupported judgments about motive or character. Every recommendation comes with what backs it and what still needs checking.
Bring the one you keep getting asked about.
For a stalled project, a partial rollout, or a launch that hasn't paid off, the Priority Snapshot provides a written assessment within 24 hours of the session: what the evidence supports and what to do next. $1,500, fixed.
For a proposed commitment, Decision Challenge examines whether the evidence supports going ahead. Scope, fee, and timing are agreed separately.
