
Operational Payoff · Operations consulting
The Five Capacity Taxes: Where the Cost of a Stalled Result Lands
Emergent Skills conducts focused operational investigations into why important work is not producing the expected business result. The Five Capacity Taxes organize some of the costs and exposure that may appear in that investigation; they do not determine the cause.
Execution drag is the gap between the performance you pay for and what your operating conditions let people deliver. Skill is on the payroll. Access to it is not on any report. The Five Capacity Taxes are where that gap turns into cost. Recovery Debt needs evidence of continuing effects on reliable performance. Forfeited Upside needs a basis for the value at stake, with assumptions stated separately. Those differences matter once the number reaches the executive who wasn't in the room.
Before you fund the fix, find the right problem.
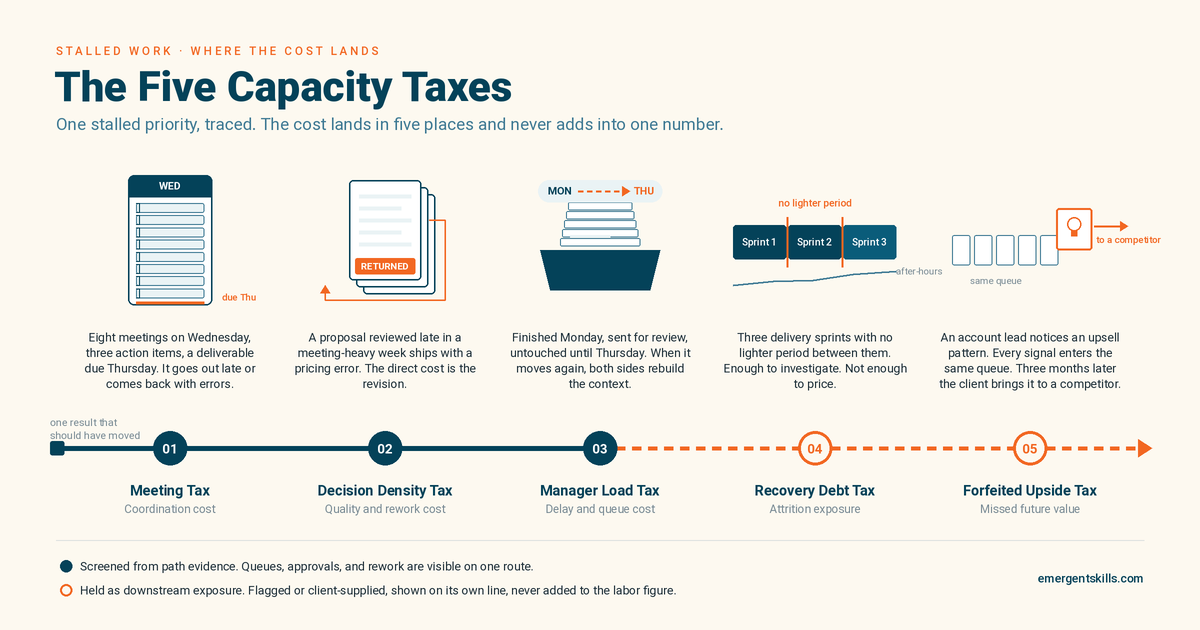
A Tax can carry cost from the work path itself, from conditions around the work that reduce reliable access to judgment, or from both at once. The Taxes can overlap. They are cost lenses inside the investigation, not explanations by themselves. The examples below are the kind of thing that makes us look harder, not a diagnosis.
01
Meeting Tax
Coordination Cost
What It Is
Coordination that eats production time. Meetings, alignment, checking, the message thread that stands in for a decision. The meetings are not the problem in themselves. The problem is that after enough of them there is no protected stretch left in which to do the work they were about.
What It Looks Like
Eight meetings on a Wednesday, three action items, forty unread messages, and a deliverable due Thursday. It goes out late, or on time with errors in it.
02
Decision Density Tax
Quality & Rework Cost
What It Is
Consequential decisions that stack up, get delayed, get escalated, or all run through the same two people. Wait, reversal, and cleanup follow. A single bad call under pressure tells you nothing on its own. Several of them, on the same kind of week, start to.
What It Looks Like
A proposal reviewed late in a heavy week goes out with a pricing error. The revision is the direct cost. The question worth asking is whether that kind of miss keeps showing up under the same load.
03
Manager Load Tax
Delay & Queue Cost
What It Is
Work, approvals, escalations, and exceptions all routed through one manager. The queue slows work behind it. We also check whether frequent switching contributes to errors, reversals, or rework.
What It Looks Like
Finished on Monday, sent for review, back on Thursday. By then both people have to rebuild the context before anyone can move it.
04
Recovery Debt Tax
Continuing Operating Burden
Requires evidence of continuing effects on the work
What It Is
Sustained operating demand that can create a continuing burden on reliable performance. We look for observable effects on the work. Any turnover exposure needs separate evidence and stays on its own line.
What It Looks Like
Three delivery sprints back to back with no lighter period between them. Output slows, review cycles stretch, after-hours work stays high. That is enough to make us look, but not enough to put a figure on, and we won't.
05
Forfeited Upside Tax
Missed Future Value
Separate opportunity exposure · Client-supplied · Never added automatically
What It Is
The future value that never arrives because strategic work, customer signals, and half-formed ideas get no protected capacity and no route to action. It can only be valued from your pipeline and your assumptions, and it stays on its own line.
What It Looks Like
An account lead notices an upsell pattern. Every signal goes into the same overloaded queue as everything else. Three months later the client brings the idea to a competitor.
An initiative closes green and the benefit in its business case never starts, because the work that turns a delivered tool into a result had no owner.
How to create value from available capacity →
Delivered, no result: find the work nobody was assigned →
What the Snapshot does with the Taxes
The Stalled Priority Snapshot investigates one result that should have moved. The 90 minutes is the working session, not the whole investigation. Written input from typically 6–8 contributors and available records are reviewed around a session with up to three people who move, approve, or unblock the work. We start with the result and its prerequisites, check necessary work and ownership, reconstruct the work path, examine conditions around execution, and keep competing explanations open. A Tax comes in only as an associated cost or exposure, stated separately from the finding about cause.
The evidence may show that the work path is not the explanation at all: the outcome may have been poorly defined, necessary work may never have been assigned, an external dependency may be setting the pace, or another explanation may fit better. When that happens, the read says so. A Tax is named only where the evidence supports that exposure.
Where the evidence supports an estimate, we show the extra labor you can trace, with the arithmetic and the confidence level on the page. Elapsed delay is reported separately in days where supported, not priced into labor. The Taxes are not added to each other. The Snapshot does not rate individual performance. If the evidence identifies a capability, conduct, or performance issue, the readout says so.
When the issue crosses teams or the explanation is disputed, the written readout can also give the result owner an independent finding tied to the record and clear enough to take back across the organization.
Screened from path evidence
Meeting Tax · Decision Density Tax · Manager Load Tax
A single route's records can show waits, queues, approvals, handoffs, rework, and meeting cycles. We check whether that evidence supports one of these three Taxes. Where it supports a change, we propose a 14-day test.
Assessed separately
Recovery Debt Tax · Forfeited Upside Tax
For Recovery Debt, the Snapshot assesses whether the available work evidence links sustained demand to continuing execution problems. Any turnover exposure needs separate evidence. Forfeited Upside is different. If you give us the basis, we show it, on its own line, marked as your assumption.
In the fictional sample read the pattern was serial gating and the exposure was Manager Load Tax, with roughly 60 percent of the elapsed life spent in a queue. The full method, including how the Capacity Audit prices exposure with overlap controls, is in the Execution Drag white paper.
Investigate the result. Check the evidence.
Choose the next step.
Bring one result that should have moved by now. We test the competing explanations against the work and the evidence. You get a written finding on what is supported, what remains uncertain, and one recommended next step. Where the evidence supports them, the readout includes an extra-labor estimate and a proposed 14-day test.
