Project delays · Project bottlenecks · Flow efficiency · Cost of delay
Why Projects Stall: Eight Causes of Project Delays
Projects rarely stall because people stop working. They stall because a critical decision, approval, dependency, or handoff cannot clear while activity continues around it.
The symptoms are ordinary: slow decision-making, aging approvals, missed handoffs, competing priorities, repeated rework, and a route that depends on one overloaded manager. Together, these project bottlenecks create what Emergent Skills calls execution drag. The parent page explains the pattern across an operation. This page traces it through one stalled outcome.
The first question is arithmetic. What share of this outcome's elapsed life was spent being worked on, and what share was spent waiting? That ratio is its flow efficiency. Most organizations cannot produce it for their most important stalled work, or say what those months have already cost. Neither number is on a dashboard. Both are recoverable from records you already keep.
Start the Stalled Priority Snapshot Run the Execution Drag Calculator
Executive SummaryWhat a stall is, and where the evidence lives.+
A stalled project has one address: a critical condition that cannot clear. Nobody has enough ownership, authority, information, or available capacity to move it. Work continues around the blockage, which is why it stays invisible. Status meetings, updates, partial work, and revised schedules all keep producing output while the value-bearing route remains blocked. Emergent Skills calls the accumulated waiting, looping, and rerouting execution drag.
On time, the argument reduces to one number almost nobody has: the share of a stalled outcome's elapsed life spent waiting rather than being worked on. That ratio is its flow efficiency. Whatever the share turns out to be, the remainder is the ceiling on everything aimed at the work itself, including training, tooling, headcount, process improvement, incentives, effort, and AI assistance. That is an identity rather than a research finding, and it holds at any ratio. What it does not settle is how much of the waiting is removable, or which waits sit on the critical route rather than in parallel with it. A Snapshot answers that from your own record.
On cost, two things are establishable from one outcome's record, and they are reported separately. The hours you can defend are the labor the stall consumes in meetings, context reconstruction, escalation, and rework, countable from the calendar. The elapsed delay is reported on its own and never folded in, because valuing it rests on your assumptions about benefit rather than on our evidence. What one outcome cannot price is the load the stall put on the people carrying it, or the exposure from it recurring. Both belong to the operation rather than the instance.
Eight causes produce stalls, in three groups. Two were set at the point of approval, before the work path existed. Four sit on the work path, leave timestamps, and can be established in one session. Two are conditions of authority and change that show up indirectly. The group tells you where the evidence lives, not who owns the fix.
Three instruments run in order on a Snapshot, and confusing them is how a diagnosis gets overclaimed. Five gates screen whether the outcome is traceable at all, or whether it is a strategy, specification, resourcing, or external problem wearing a stall's clothes. The trace establishes work-path friction on its own evidence, with no claim about anyone's state required. The Four Tests apply only to the narrower claim that demand conditions have also reduced reliable access to existing skill, and most Snapshots do not need it. The Snapshot page carries the full method.
Some fixes are not ours. Tooling and platform consolidation, staffing levels, incentive design, and external dependencies can all produce real drag and all fall outside what we remediate. If that is where your stall lives, you will hear it in the first session. The usual first step is a $1,500, 90-minute Stalled Priority Snapshot on one stuck priority, ending in one 14-day experiment designed to be capable of failing. When the pattern reaches past one priority, the Work Demand Diagnostic is the next step.
Flow efficiency and the cost of waiting
Flow efficiency: the one number nobody has
Waiting is reported in calendar days. Work is reported in touch hours. The gap between the two numbers is the finding.
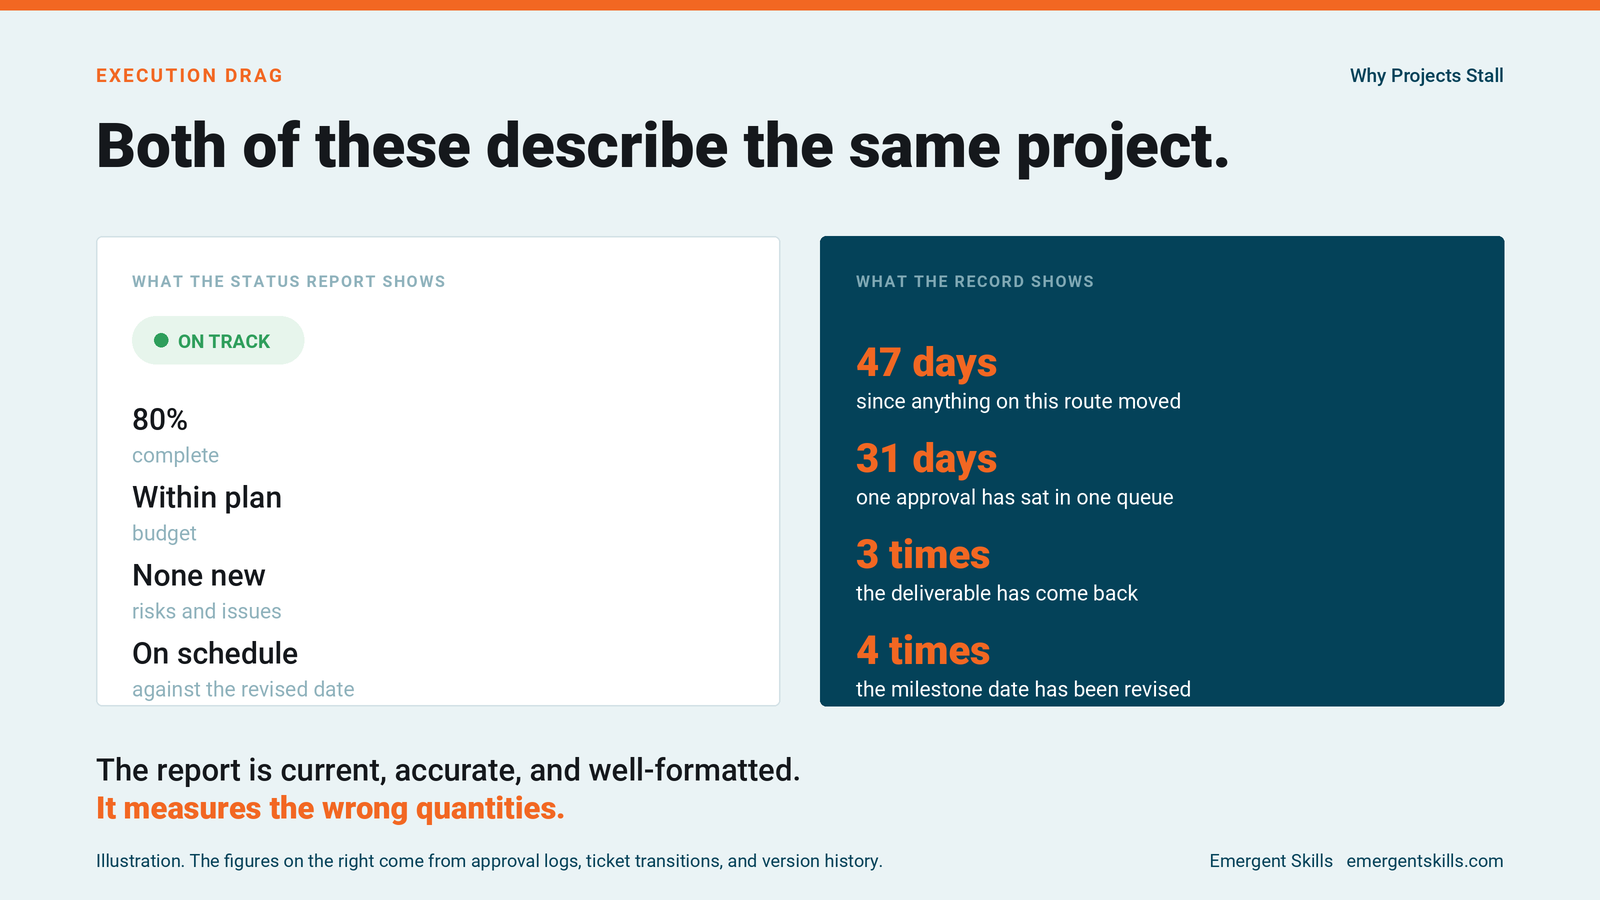
A stalled project usually has a current, accurate, well-formatted status report. It measures the wrong quantities. Project-management dashboards show activity, status, and deadlines, but they rarely expose the project bottlenecks creating the delay. At the system level, why execution stalls explains how that pattern spreads across an operation. This page asks the narrower question: how long has this outcome been waiting, and why?
What reports show
- Percentage complete
- Tasks completed
- Budget consumed
- Milestones
- Red, amber, or green status
- Risks and issues
What they leave out
- Percentage of elapsed time spent waiting
- Age of unresolved decisions and dependencies
- Number of reopenings, and whether the definition of done moved
- Approval concentration
- Work in progress competing for the same people
- Whether the next milestone has a clear route to completion
The first column measures activity. The second measures flow. A project can report 80% complete for months on the strength of the first column alone, while the remaining 20% holds the integration, the acceptance, the decision, or the dependency the entire outcome rests on.
So take your most important stalled outcome. What share of its elapsed life has been spent waiting, rather than being worked on by anyone? Flow literature calls that ratio flow efficiency.
Almost nobody can answer that question about their own most important work.
It is not on any dashboard. It is recoverable from records you already keep. And it is the number that decides where improvement is available, which is why we establish it before anything else.
Here is why, and this part is arithmetic rather than research. Suppose one fifth of elapsed time is touch work and four fifths is waiting. If the waiting remains unchanged, eliminating every touch hour reduces elapsed time by no more than one fifth.
Some of that waiting is created by the rate of work itself, and that part does move when the work gets faster or when another pair of hands arrives. The rest comes from approval cadence, shared-resource queues, batching, dependencies, and priority competition, and none of it moves when this team gets faster. The ratio shows where elapsed time accumulates. The trace determines what can change it.
You can check which kind you have. If total touch time across the whole route is small relative to a single step's elapsed time, the route is not congesting itself, and the waiting is arriving from outside it.
We are not going to hand you a benchmark. Published flow efficiency figures for knowledge work exist, and quoting one would invite the only response it deserves, which is that your organization is different. It probably is. Your record has your number in it, and extracting it takes hours.
The ratio also does not tell you which waits sit on the critical route and which sit in parallel with it, where halving them changes nothing. That is a question for the trace.
Execution drag has a price, in two currencies
What the stall has already cost
One outcome's record supports two numbers, and we keep them apart on purpose. Combining them produces a bigger figure and a weaker argument.
One: the hours you can defend
Meetings called to discuss the stall. Time spent reconstructing context after each handoff or reopening. Escalation calls, and the people pulled into them. The rework itself. All of it sits on a calendar somewhere, attributable to this outcome rather than estimated for it.
Countable from: calendar entries, meeting logs, revision history, escalation threads.
Two: the elapsed delay, reported separately
The calendar days spent waiting rather than being worked on. That is the cost of delay, and it stays out of the labor figure above, because pricing a day of delay rests on your assumptions about the benefit that day would have delivered, not on evidence we can produce.
Countable from: stalled outcome's elapsed time, minus the touch time already established in the trace.
Neither number prices what the stall cost the people carrying it, or what it costs to have this happen again. Both belong to the operation, not to one outcome, which is what the Work Demand Diagnostic is for.
 What causes projects to stall
Why projects stall: eight recurring causes of project delays
These eight causes include competing priorities, decision bottlenecks, missed handoffs, rework, manager bottlenecks, and changing operating conditions. The first two sit upstream of the work path and were set before the project started. The next four live on the work path itself, produce timestamps, and can be traced in a single session. The last two are conditions of authority and change that rarely produce their own record and instead show up in the effects of the other six.
The groups tell us where to look for evidence and how confidently a condition can be established in one session. They do not tell us who owns the fix, which is decided case by case and often sits with the sponsor regardless.
Whatever the condition, its effects reach the record in one of four ways. Work waits, work loops, work piles up, or work routes through overloaded people. We start with the effects, because they carry a timestamp and the conditions behind them often do not. What that buys you is a starting point that is not a person.
1. The project is approved before it is understood
The outcome, requirements, benefits, delivery route, or constraints are not sufficiently understood at the point of commitment.
Observe: repeated discovery, missing requirements, unresolved assumptions, early re-baselining.
2. Competing priorities create capacity constraints
Shared people and resources are divided across more work than the system can finish. Work in progress climbs, workloads become harder to manage, and every new commitment borrows capacity from another priority.
Observe: starts exceed finishes, priorities change constantly, milestones all move right together.
3. Decision bottlenecks form
The decider is unclear, too many people hold a veto, or the decision waits for a meeting that convenes every other week. Slow decision making usually traces to one of those three.
Observe: aging decision log, repeated discussion of settled questions, postponed approvals, reversals.
4. Missed handoffs and dependencies create queues
Progress depends on another team, vendor, specialist, system, approval, or piece of information. The handoff has no clear owner, acceptance rule, or response time, so the dependency waits in a queue.
Observe: blocked days, handoff count, follow-up touches, queue age.
5. Rework returns completed work to the queue
Requirements, completion criteria, reviewer involvement, or quality expectations arrive after the work was already done once. The resulting rework loop consumes capacity without moving the outcome forward.
Observe: revision count, reopened tasks, repeated review, late defects, a definition of done that moved.
6. Manager bottlenecks constrain the critical route
Difficult decisions, approvals, and rescue work route through the same manager, expert, or sponsor. Across more than 300 organizations, Cross, Rebele, and Grant found 3% to 5% of employees accounting for 20% to 35% of value-adding collaboration, and described those people becoming bottlenecks whose input everything else has to wait for. Collaborative Overload
Observe: approval concentration, rescue work, escalations, after-hours intervention.
7. Sponsorship or adoption weakens
Nobody with authority protects the project, resolves conflicts between it and competing work, or changes the operating conditions adoption requires.
Observe: unresolved tradeoffs, conflicting messages, workarounds, old and new processes running in parallel.
8. Conditions change but the plan does not
Technology, regulation, customer requirements, leadership, staffing, or strategy moved, and the schedule was revised without a genuine replan.
Observe: schedule revisions with no scope decision, hidden work, assumptions nobody has revisited.
These causes compound. An unclear requirement creates a loop. The loop reaches an overloaded expert. The expert's queue creates waiting. The delay triggers escalation. The escalation adds meetings and approvals. The new controls lengthen the route further.
Diagnose the priority that should have moved.
Bring one stalled milestone, decision, or deliverable and the record behind it. The usual first step is a $1,500, 90-minute Stalled Priority Snapshot. We reconstruct the actual work path, establish how much elapsed time was waiting, identify the strongest observable bottleneck, put a conservative number on the hours you can defend, and design one 14-day routing experiment with its rejection condition written down in advance. It produces a credible local routing hypothesis, not a measured outcome. If competing priorities, manager overload, or work demand are creating the same delay elsewhere, the Work Demand Diagnostic is the next step, and we will tell you when it is not.
If you would rather size the exposure before talking to anyone, the Execution Drag Calculator takes three inputs and under two minutes.