
Work Demand Design · For Operating Leaders
When capable people keep missing, test the demand before blaming the people.
Work Demand Design is how an organization controls what enters the system, how much stays open, where work waits, who decides, and how much operating margin remains for consequential work.
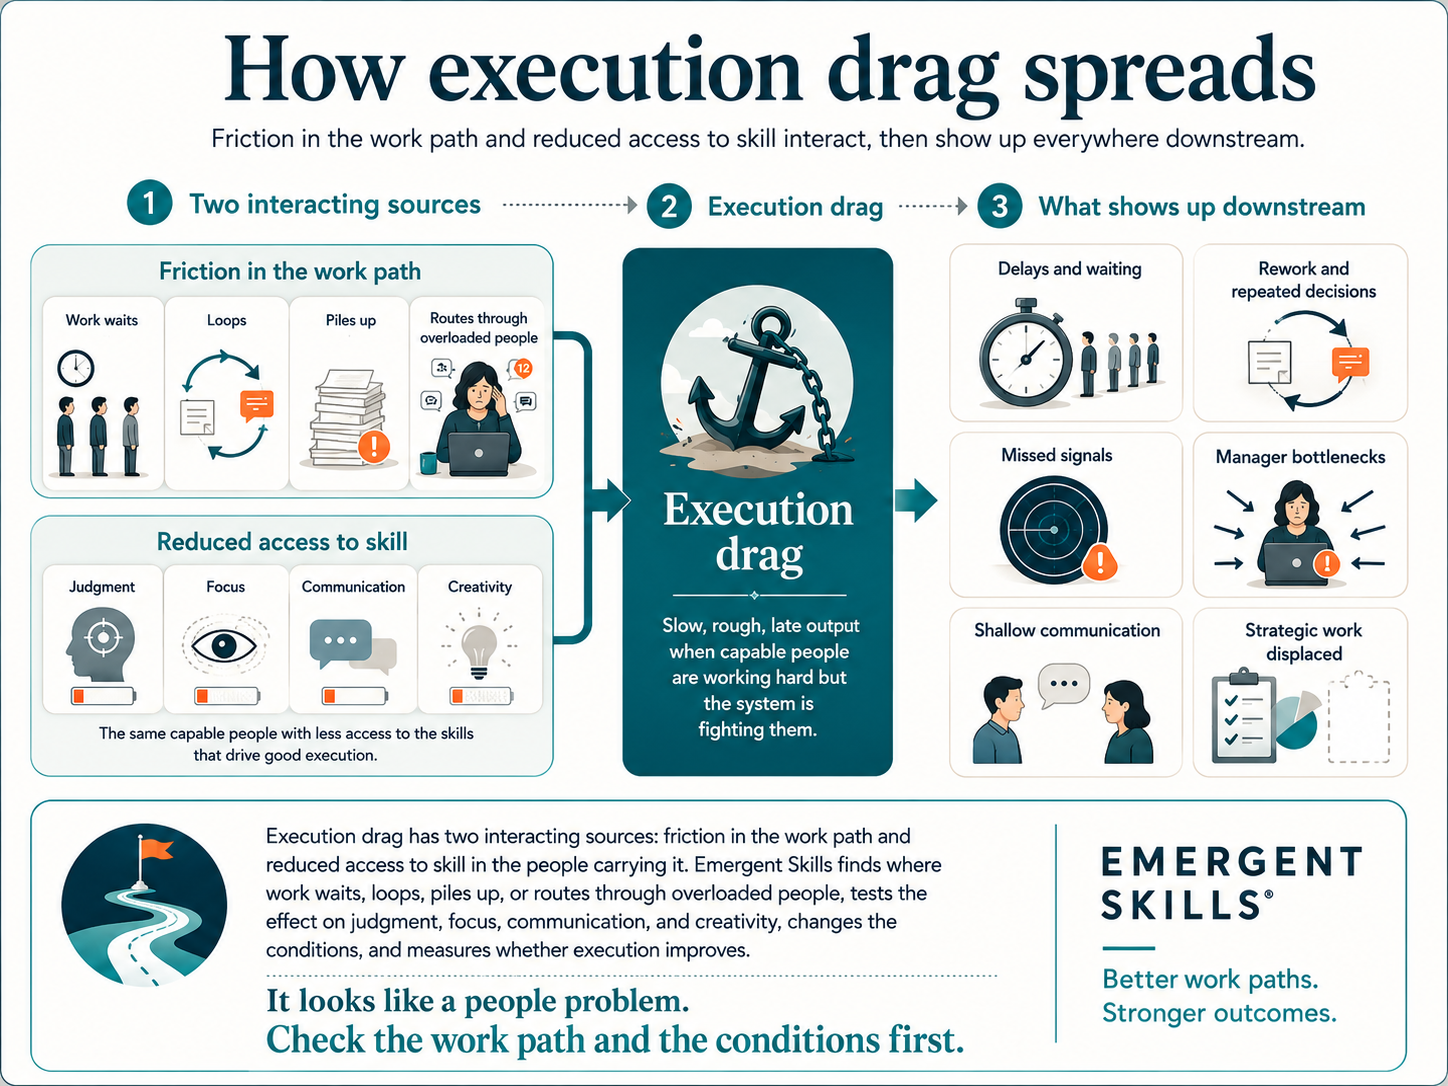
Emergent Skills traces the actual work path first. We find where work waits, loops, piles up, restarts, or repeatedly routes through overloaded people. Where the evidence supports it, we also test whether those same conditions are reducing reliable access to judgment, focus, communication, creativity, and technical skill.
Useful demand stays. Avoidable friction, excess work in progress, and poorly routed load come out.
Executive SummaryHow demand design becomes execution drag.+
Work Demand Design examines what enters the system, how much stays open, where work waits, who decides, and how much operating margin remains for consequential work.
Execution drag can move through two routes. Work-path constraints can create waiting, rework, or delay directly. The same demand conditions can also reduce reliable access to existing skill. The Four Tests apply only to that narrower capacity claim.
ES organizes demand into seven operational types: time, volume, and work-in-progress pressure; decision complexity and density; meeting, interruption, and handoff load; emotional load; change load; low control and unclear routing; and operating margin and restoration limits.
Flow evidence can establish structural drag. Baseline shift, load signature, and shared conditions determine whether a capacity explanation is credible enough to test. The Pilot tests reversibility.
The Five Capacity Taxes are overlapping cost lenses and are never summed into one total. Meeting, Decision Density, and Manager Load can support the drag floor once overlap is controlled. Recovery Debt and Forfeited Upside are separate exposures reported on top of it.
Use the Stalled Priority Snapshot for one stuck route and the Work Demand Diagnostic for a recurring pattern. The Audit, Pilot, and License deepen the evidence and sustain the discipline after proof.
The Core Model
Demand reaches the numbers through the work path and, sometimes, through reduced access to skill.
The two routes can exist separately or reinforce one another. ES tests each route on the evidence appropriate to it.
Direct work-path route
Work demand and flow design
What enters, how much stays open, where it waits, who decides, and how the work moves
Work-path constraint
Waiting, queueing, repeated review, broken handoffs, restarts, or rework
Operating loss
Longer cycle time, delayed output, added labor, missed commitments, or lost throughput
Capacity-mediated route
Work demand conditions
Dense decisions, fragmented days, sustained pressure, low control, and inadequate operating margin
Reduced access to existing skill
● ● ● ●
Judgment, focus, communication, creativity, and technical skill become harder to access reliably
Execution and operating loss
Reversals, quality problems, rework, missed signals, strategic displacement, or attrition exposure
This route is classified only when the Four Tests support it.
The routes can compound. A queue forces more switching, incomplete decisions create more review, and the extra review enlarges the queue. Capacity is variable access to existing skill in the moment, but work-path evidence does not require a capacity explanation.
The diagnostic guardrail. Queues, broken handoffs, approval loops, rework, unclear decision rights, and too much work in progress can establish structural drag directly. Baseline shift, load signature, and shared conditions establish whether a capacity explanation is credible enough to test. The Pilot tests reversibility. A failed test withholds the capacity claim; it does not erase structural evidence already found or identify another cause by itself.
What Creates the Load
ES organizes work demand into seven operational types.
“The team is overloaded” is too broad to act on. The useful question is which demand is concentrating, where it originates, how it enters the work path, and which operating result it may be affecting.
Time, volume, and work-in-progress pressure
Too much work enters, too little finishes, and too many priorities remain active at once. Deadlines become the visible pressure, but excess work in progress is often the underlying condition.
Decision complexity and density
Hard calls, ambiguity, and tradeoffs become more demanding when too many consequential decisions stack up before judgment and context can be restored.
Meeting, interruption, and handoff load
Meetings, messages, searches, interruptions, and handoffs divide the workday into pieces too small for consequential work and add delay each time work changes hands.
Emotional load
Difficult customers, conflict, uncertainty, and the work of holding steady when conditions are tense. This is an operating demand, not merely a personal resilience issue.
Change load
Reorganizations, reprioritization, systems or AI rollouts, integrations, new leaders, and tool churn can add learning, review, exception, and parallel-process demand while the existing work still has to ship.
Low control and unclear routing
Work arrives with little clarity over timing, ownership, decision rights, evidence requirements, or escalation paths, so it waits, bounces between people, or returns as rework.
Operating margin and restoration limits
Work arrives without adequate pauses, coverage, protected capacity, or space between consequential tasks. The next peak begins before the system has restored enough operating margin to carry it reliably.
Cause Into Cost
Demand and flow are what you can redesign. The Taxes show where cost may concentrate.
The Five Capacity Taxes are overlapping cost lenses, not root causes. ES identifies the work-path pattern first, tests whether a capacity effect is also present, connects the evidence to the relevant Tax exposure, controls overlap where the data allow, and reports Recovery Debt and Forfeited Upside separately rather than adding them to the floor.
How the Taxes report. The drag floor is the directly traceable extra labor: hours spent chasing, reworking, reviewing again, meeting without a decision, and rebuilding context. Elapsed delay is reported separately from that labor, not folded into it. Meeting, Decision Density, and Manager Load can support the floor once overlap is controlled. Recovery Debt and Forfeited Upside are separate exposures reported on top of it, each requiring its own evidence. The five are never summed into a single total.
Meeting Tax (coordination cost)
Common contributors meeting, interruption, and handoff load; time, volume, and work-in-progress pressure. Coordination displaces or fragments consequential work.
Operational signals meetings with no decision or shipped output, fragmented focus periods, deferred decisions, and difficult work pushed after hours.
Decision Density Tax (quality and rework cost)
Common contributors decision complexity and density; low control and unclear routing; operating margin and restoration limits. ES tests whether reversals, rework, forecast misses, or decision latency cluster under identifiable demand conditions.
Operational signals reversals, downstream cleanup, slow approvals, missed forecasts, and quality problems after stacked decisions or meeting-loaded stretches.
Manager Load Tax (delay and queue cost)
Common contributors low control and unclear routing; change load; time, volume, and work-in-progress pressure. Too many decisions funnel through one person. Test the queue and decision design, not the manager's character.
Operational signals approval-queue age, delivery variance, repeated escalation, manager after-hours work, and teams waiting on one route.
Recovery Debt Tax (sustained performance and attrition exposure)
Common contributors time, volume, and work-in-progress pressure; emotional load; operating margin and restoration limits. Recovery Debt is a separate exposure reported on top of the drag floor, never added into it, and it requires longitudinal and turnover evidence.
Operational signals sustained after-hours load, failure to restore normal operating patterns, narrowing role behavior, and regretted attrition over time.
Forfeited Upside Tax (missed future value)
Common contributors operating margin and restoration limits; time, volume, and work-in-progress pressure. Sustained demand leaves no margin for strategy, pattern recognition, preparation, or creation. Visible work may still ship while future value is displaced.
Operational signals postponed strategic initiatives, customer signals not pursued, ideas not developed, and high-value work that never reaches execution. The inventory is counted, not estimated: ES produces the list and the business attaches the values.
How the Capacity Audit estimates each Tax and controls overlap →
Operating Margin
Operating margin is not waste.
A system can look lean while losing the ability to absorb variation. One absence, consequential decision, urgent customer request, or upstream change can turn a full schedule into a destabilizing queue.
Operating margin does not require idle people. It can mean a work-in-progress limit, backup approver, protected decision time, fewer simultaneous priorities, reserve coverage for spikes, or space between consequential tasks.
Basic queueing models show that waiting time can rise rapidly as utilization approaches available capacity. The precise relationship depends on variability, priorities, staffing, and system design. The ES implication is narrower: some operating margin can be load-bearing rather than waste. MIT OpenCourseWare provides the formulas and assumptions.
Knowledge-work evidence: The joint Harvard and MIT Work and Well-Being Initiative summarizes a randomized intervention in a Fortune 500 IT division. Greater control over work time, a shift from face time to results, and stronger manager support were associated with lower stress and burnout, lower likelihood of leaving, and no decline in performance over time. This supports the work-design logic, not the ES model.
The ES hypothesis: restore enough operating margin to make redesign possible, then change what flows through it. Remove, simplify, delegate, or resequence avoidable demand and use the Pilot to test whether queue age, cycle time, rework, after-hours load, strategic completion, or another agreed operating metric changes.
The guardrail. Lean, kaizen, and related methods are not the problem. Use them to remove avoidable demand and improve the work system, not simply to reclaim every freed hour and push utilization back to the edge.
Upstream Demand
The team may not have lost discipline. The demand may have changed around them.
A team can carry demand it did not create. Marketing pulls a launch forward two weeks. A board-deck request lands Friday at five. A reorganization reshuffles priorities mid-quarter. Approvals back up two levels above the people waiting on them. None of it was the team's call. All of it enters the team's work system.
The frontline can receive the post-mortem for instability that entered through the planning calendar, approval chain, priority process, or senior request. The analyst is told to tighten up. The account lead is told to communicate better. Meanwhile the upstream load appears downstream as queue age, manager after-hours work, delayed decisions, rework, and Recovery Debt exposure.
The read for whoever holds the lever: before asking a team for more, identify what demand the system is adding, where it originates, and whether the source of the fix sits upstream from where the cost appears. Individual effort alone cannot reliably close a gap the work system keeps reopening.
Evidence from a different setting: A randomized study across 28 Gap stores found that more stable scheduling increased median sales by 7% and labor productivity by 5%. Only 30% of weekly payroll-hour variability was explained by traffic. Managers identified shipment information, last-minute promotion changes, and corporate visits as major headquarters-driven sources of instability. This retail evidence illustrates how upstream decisions can destabilize downstream work; it does not prove ES or knowledge-work outcomes. Read the study.
Load Transfer
Before you add people, test what can be removed, simplified, delegated, or transferred.
Adding capacity may be the right answer when the workload is structurally larger than the system can carry. But headcount should not be the automatic answer to avoidable coordination, unclear intake, or decision work sitting with the wrong role. One common design move is to take low-value administration and coordination off high-value specialists so their hours return to the work only they can do.
Manager → operations coordinator
Route routine coordination and organizational noise away from the manager so consequential decisions stop queueing behind work that can be handled elsewhere. This tests whether routing is contributing to Manager Load Tax.
Closer → deal desk
Move pricing administration, paperwork, and routine approvals away from the person whose highest-value work is selling. Protect revenue-producing judgment and time.
Engineer → clean intake
Clarify requirements, ownership, evidence, and acceptance criteria before work reaches the engineer so the build does not open with avoidable triage and rework.
Executive → decision pre-brief
Stage the context, options, tradeoffs, and recommendation before the room so senior judgment goes to deciding rather than rebuilding the problem from scratch.
The pattern to test is expensive judgment being spent on work that another role, a cleaner process, a form, automation, or a pre-brief could absorb. Redesign it, then measure whether queue age, cycle time, rework, manager after-hours work, or strategic completion moves.
What This Is Not
This is not a call to make work easier.
Some work should be hard. Strategic work, customer work, technical work, and leadership work all require demand. The question is whether the system is spending that demand on the work that matters or wasting it on avoidable meetings, unclear routing, unsupported decisions, preventable queues, and unnecessary rework.
Work Demand Design keeps useful pressure and removes design debt. It does not assume redesign solves every problem. Staffing shortages, skill gaps, role mismatch, poor strategy, tooling constraints, incentives, and external dependencies may require different action.
It is not a wellness program, employee-monitoring system, or training-only intervention. It is the organizational layer of Performance Infrastructure for Demanding Knowledge Work. Private individual support and manager routing practices reinforce the redesign, but they do not compensate for a work system that keeps creating avoidable friction and load.
Connection to the Zones Framework
Work Demand Design changes the conditions. Zones help route the next work.
Zones are private individual signals and shared routing logic, not management telemetry. Managers route from capacity an employee chooses to declare, observable load, and task consequence. They do not receive private app activity, Zone history, or live individual-state data.
Where It Connects
Work Demand Design is one organizational layer in the complete ES system.
The organizational layer changes the recurring work path. Managers route the next work from declared capacity, observable load, and task consequence. Individuals privately reset, build capability, and deploy usable capacity.
Use the Stalled Priority Snapshot for one stuck priority and the Work Demand Diagnostic for a recurring pattern. The Audit builds the cost and intervention case, the Pilot tests the change, and the License sustains the discipline after proof.
Individual app activity remains private. Organizational reporting uses privacy-protected aggregate patterns and outcomes, with no Zone history, live state monitoring, manager drill-down, or use in performance evaluation.
Trace the demand behind the drag.
Bring one priority that should be moving and up to three people who move, approve, or unblock it. The $1,500, 90-minute Stalled Priority Snapshot reconstructs the actual path, estimates the directly traceable drag floor, and defines one 14-day routing experiment. You receive a one-page read within 24 hours. The fee credits toward the Work Demand Diagnostic when booked within 30 days.
When the problem extends across several priorities, managers, or workflows, begin with the Work Demand Diagnostic.