Operational Payoff · Operations consulting · Capacity Audit
Capacity Audit: measure what is driving a recurring execution problem.
Emergent Skills is an operations consulting firm that conducts focused operational investigations into why projects stall, results fall short, and problems keep coming back. The Capacity Audit is the deeper investigation when a recurring pattern across a defined team, department, or function needs stronger operating and economic evidence before a larger decision is made.
The Audit revisits the business result and basic conditions, checks necessary work and ownership, reconstructs the work path, examines whether surrounding demands contribute to execution failures, and keeps competing explanations open. You get a CFO-readable operating case: what the evidence supports, what it appears to be costing, what remains unresolved, and the next decision.
This is not a compliance audit against a fixed standard. It is an operational investigation into what is producing the shortfall and what the evidence justifies doing next.
Before you fund the fix, find the right problem. The Audit does not assume the answer. It separates supported findings, hypotheses, competing explanations, and unanswered questions. A capacity effect is tested only when the evidence raises that question.
Executive SummaryThe evidence. The cost. The intervention case.+
The Capacity Audit is a deeper operational investigation of a recurring execution pattern across a defined team, department, or function. It can carry forward a Snapshot’s local findings and the Work Demand Diagnostic’s pattern map, cost assumptions, test results, and unresolved questions. It checks those inputs against deeper operating evidence to build the economic case and resolve the next decision.
We test competing explanations rather than assuming one root cause. That includes outcome validity, priority, prerequisites, external dependencies, necessary work and ownership, Route 1 work-path problems, Route 2 work-demand contributions, incentives, decision rights, execution discipline, and other case-specific causes. When a capacity effect is suspected, the Four Tests are applied separately. Reversibility requires evidence from changed conditions.
What gets examined: the business result and prerequisites, necessary work and ownership, the actual work path, work-demand evidence, competing explanations, and the economics. Capacity evidence and the Five Capacity Taxes are used when relevant.
- Meeting Tax
- Decision Density Tax
- Manager Load Tax
- Recovery Debt Tax
- Forfeited Upside Tax
The Taxes are overlapping cost lenses. Supported operating loss forms the floor with overlap controls. Person-hours of extra labor stay separate from calendar delay; waiting becomes a dollar figure only with a supported financial basis. Recovery Debt requires evidence of a continuing burden affecting reliable execution. Any turnover cost needs its own supporting evidence. Forfeited Upside remains separate and client-supplied.
Why bring in an outside investigation: when a recurring problem crosses teams, people give conflicting accounts, or the sponsor needs a finding that can stand apart from internal politics, the Audit provides an independent evidence record for the next decision.
Why now: AI can remove work. It can also create new work: checking outputs, cleaning them up, handling exceptions, and deciding when a person needs to step back in. The Audit looks for both. It treats AI as another place execution drag enters the system, not as a sixth Tax.
Proposed deliverables, confirmed during scoping: a one-page COO Brief, a 30 to 45 page findings report, a 15 to 20 slide executive presentation, a privacy-protected data and calculation appendix, a ranked intervention portfolio, and a Pilot measurement plan where warranted. If a Pilot is premature or unnecessary, the report records why and the next proportionate action.
How it runs: evidence can include work-demand and priority mapping, work-path and queue analysis, operating records, structured manager and leader interviews, and voluntary privacy-protected capacity evidence where appropriate. The mix is confirmed during scoping. Planning estimates are under 20 minutes per survey participant and roughly 6 hours of leadership time across the engagement.
The current planning range is \$15,000 to \$25,000 for a single team. Larger scopes are quoted separately. The tiers below are proposed scopes and pricing assumptions, confirmed during scoping.
Three Design Partner slots for 2026. Design Partners receive founder involvement at key moments, methodology influence, cohort learning, case-study consideration where the evidence and permissions support publication, and 15% off the first engagement.
Each stage has its own decision. You can enter at the Audit when the need for deeper measurement, scope, data access, and sponsor authority are already established. The calculator is optional and produces an assumption-based scenario. A supported local fix can be the end of the engagement.
When Work Demand Is Part of the Explanation
Demand is not just workload.
Workload is only part of demand. Ten open priorities are not the same as ten sequential ones. A decision you can make yourself is different from one that waits three days for an approval. And two hours of protected work does not survive being broken into six pieces.
The Audit maps what enters, how much stays open, where it waits, who it passes through, and how often it loops or restarts.
Work-path friction can create delay and rework while capacity is intact. Surrounding demands may also contribute to errors, reversals, rework, missed handoffs, or other execution failures. The Audit tests those explanations alongside ordinary alternatives. A capacity effect is a narrower hypothesis, not the default diagnosis.
What the Audit Surfaces
Task data may leave gaps in the picture of what happened between “we started” and “we missed the date.” Where did it wait? Who had to approve it? What came back and had to be redone?
A scheduling record may show that work is late without explaining why. We reconstruct the waits, decisions, handoffs, and rework, then assess the demand conditions around them. For a launch with weak adoption, we also trace what happened between delivery and use.
The Audit connects five evidence areas.
Result, prerequisites, and ownership. Whether the expected result still matters, the priority is genuinely chosen, required capability, information, authority, funding, and other means are present, external dependencies are understood, and necessary work has a clear owner.
Work path and flow. Queue buildup, excessive work in progress, priority collisions, approval wait, weak handoffs, and rework loops. These can slow execution directly, with or without a capacity effect.
Decisions and authority. Decision latency, escalation distance, reversals, unclear decision rights, and exception handling. Where authority concentrates, one person or layer ends up setting the pace for everyone behind them.
Demand and capacity evidence. Meeting density, interruptions, stacked decisions, context reconstruction, and recovery limits, checked for links to observable errors, reversals, repeated work, or missed handoffs and assessed against baseline shift, a load signature, and shared conditions. These may support a hypothesis; they do not complete the reversibility test.
Cost and opportunity exposure. Extra labor and rework, with delay valued only where its financial consequence is supported. Recovery Debt enters only when evidence supports a continuing burden affecting reliable execution; turnover costs require separate support. Client-supplied opportunity value stays separate. The same loss is counted once.
The evidence shows how the shortfall is being produced. When relevant, the Five Capacity Taxes are cost lenses for examining where supported execution loss lands.
Keep the Work-Path Finding Separate From the Capacity Claim
A queue can be real even when the capacity effect is not.
If the work sat in an approval queue for eleven days, that delay is real whether anybody was overloaded or not. Queues, approvals, broken handoffs, excessive work in progress, unclear decision rights, and rework loops can establish a work-path problem on their own.
The capacity-effect hypothesis needs separate evidence. We assess baseline shift, a load signature, and shared conditions, recording what supports or contradicts each. Reversibility requires evidence from changed conditions. An existing documented change, a limited client-led test, or a Pilot may provide that evidence. The result may support, weaken, or leave the hypothesis unresolved. A weak capacity finding does not erase a supported work-path finding or prove another cause.
Before attributing the problem to either route, we check whether the outcome still matters, the priority is genuinely chosen, the required capability, information, authority, and funding exist, and an outside dependency controls the pace. We also check whether necessary work was identified and assigned to a named owner, and examine execution discipline: is a known, workable standard being followed? Skill gaps, role fit, incentives, tooling, staffing, or ordinary error may call for a different response. Mixed causes are reported together.
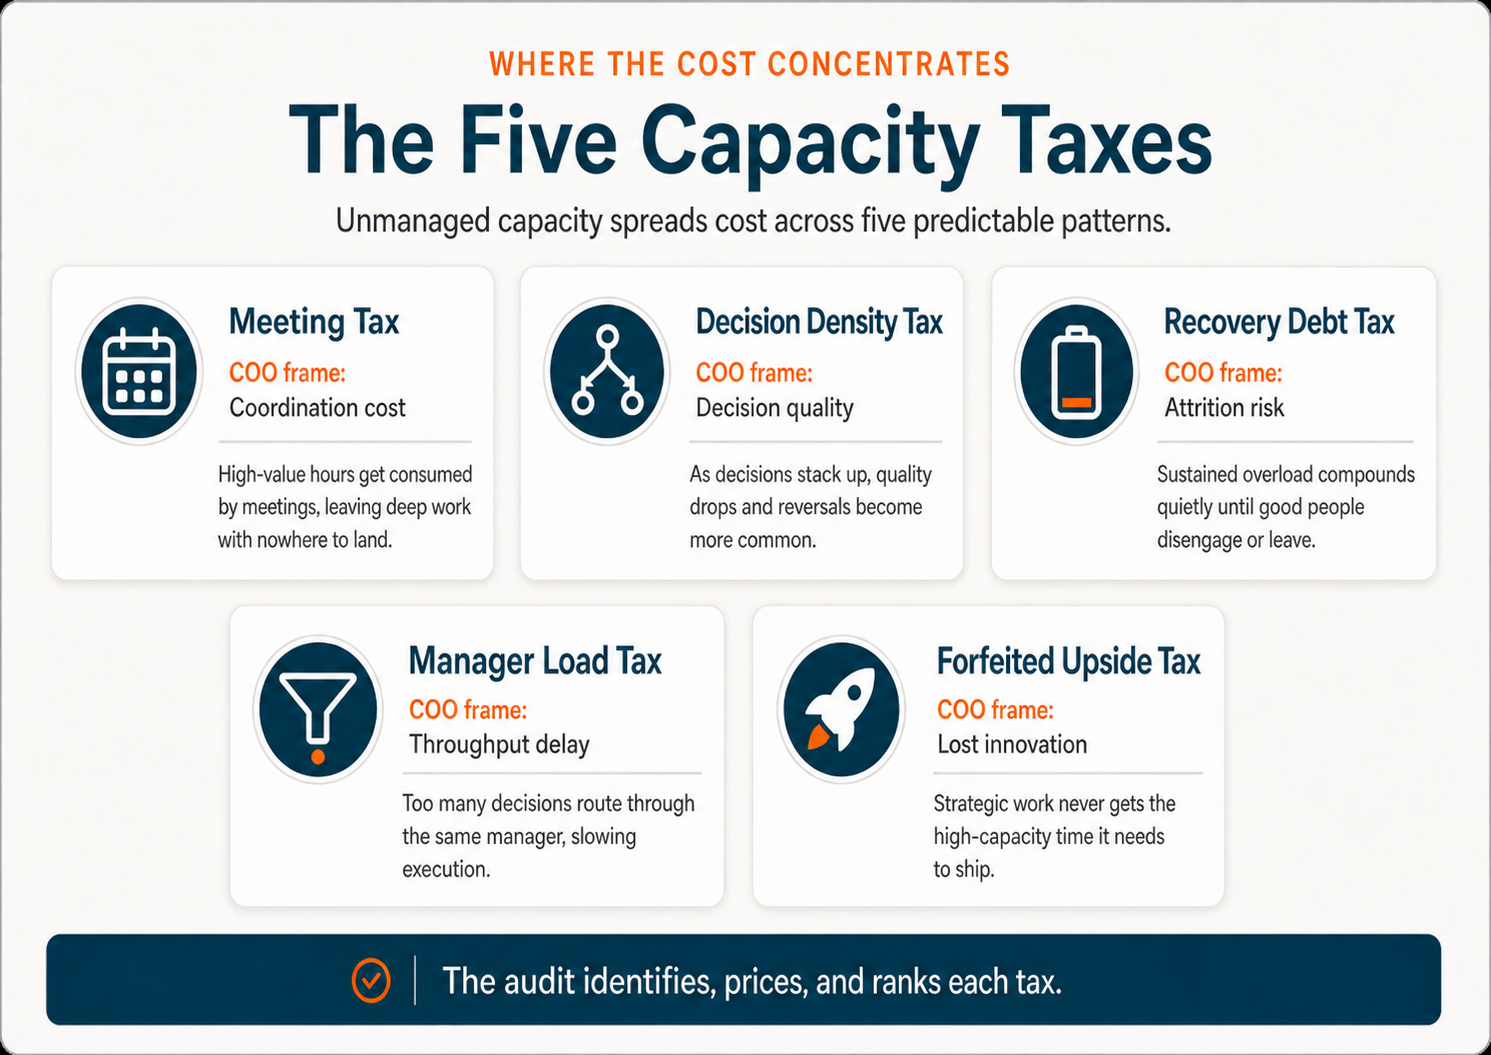
The Five Capacity Taxes
The Audit shows where supported execution cost lands.
The Taxes are overlapping cost lenses into one execution system. They are not five root causes and not five buckets to total.
Meeting Tax (coordination cost)
Meeting Tax examines excess coordination: avoidable attendance time, repeated alignment and checking, status loops, and decisions deferred without output. Necessary coordination is not automatically a loss. The Audit separates supported extra effort and flow loss from any hypothesis about reduced access to skill under repeated switching.
Decision Density Tax (quality and rework cost)
Decisions create cost in two ways. Some take too long. Others get made, reversed, reopened, and cleaned up later.
We assess whether a capacity-effect hypothesis is warranted and what would test it. Slow or reopened decisions alone do not establish that judgment was impaired.
Manager Load Tax (delay and queue cost)
Sometimes the manager is not the problem. The routing is. Too many approvals, exceptions, and decisions have been designed to pass through one person. Once that person’s queue sets the pace, everyone behind it waits.
We measure the delay and examine whether decision speed or quality changes under identifiable demand conditions. A queue alone does not establish reduced access to skill.
Recovery Debt Tax (continuing execution burden)
Recovery Debt examines whether sustained operating demand is creating a continuing burden that affects reliable execution. Any cost estimate needs evidence connecting that burden to observable operating effects. Turnover is not required to establish the burden; any turnover cost needs separate support. One hard week, one absence, or one resignation is not enough.
The Capability Penalty
Work can route to the people who handle it well. Complex problems, rescue work, emotional load, and the harder strategic decisions can concentrate on high-trust operators because they are trusted. The Audit tests whether that concentration is persistent and whether it is affecting execution. It does not assume a turnover exposure exists.
Forfeited Upside Tax (missed future value)
Forfeited Upside covers the strategic work, customer signals, useful connections, and initiatives that never get protected capacity or a viable route to action. The cause may be urgent work crowding out strategic work, decisions sitting in queues, reduced access to creativity, or some mix.
Built from specific opportunities and your own valuation assumptions. It remains separate from the operating-loss floor and is reported as a client-supplied scenario or range, not an automatic audited loss.
The Audit builds a supported operating-loss floor with overlap controls. Elapsed delay, extra labor, Recovery Debt, and opportunity scenarios remain distinguishable. If the evidence cannot support a cost floor, we say so. Recovered hours are not automatically cash savings, and no estimate is a promised return. The number carries its assumptions with it.
Where AI shows up in the Audit. When relevant, the Audit tests whether AI-generated work, validation load, cleanup, new handoffs, or over-automation are increasing structural drag or capacity pressure. For the longer treatment, see AI Didn’t Reduce the Work. It Changed the Demand Profile.
Benchmarks can establish scale. They cannot supply your operating number.
A 2025 computational model estimated about \$5.04 million in annual disengagement and burnout cost for a hypothetical 1,000-employee U.S. company with a specified workforce mix. That supports the scale of one adjacent exposure. It does not validate the ES model, represent every industry, or become your cost figure. The Audit builds its case from your work-path, operating, workforce, and opportunity evidence.
How the Audit Works
The proposed Department-tier engagement uses five weeks as a planning assumption. Duration depends on scope, evidence access, and the work cycle. This is a full investigation, not a single workshop: scoping, evidence collection, analysis, interviews, findings review, and the executive readout happen across the engagement. The evidence sequence is adapted for team, function, or enterprise scope.
Delivery: Team and Department Audits can be delivered remotely. Interviews, surveys, work-path review, operating-data analysis, and the executive readout can all be completed without onsite work. Onsite working sessions are available when a leadership team wants the findings translated directly into an operating redesign.
Phase 1: Scope the Outcome and the Evidence
We begin with any Snapshot readout, Diagnostic summary, route maps, cost assumptions, and local test results. We check what those findings support and agree which unresolved questions need deeper measurement. Then we define the outcome, work in scope, sponsor and decision authority, data access, operating metrics, and confidentiality rules. Direct Audit entry uses the same checks and records why the workshop is unnecessary.
Phase 2: Reconstruct the Work and Gather the Relevant Evidence
Evidence collection can include work-demand and priority mapping, operating records, aggregate calendar patterns, and structured manager and leader interviews. It also traces the work itself: queues, handoffs, work in progress, rework, decisions, and approvals. A voluntary privacy-protected capacity survey is added only where the capacity question is relevant.
No private app activity, individual Zone history, or live individual-state monitoring is used. Evidence streams are compared against each other. No single survey or interview determines a finding.
Phase 3: Test the Claims and Quantify the Exposure
We distinguish recorded waits, work, and rework from estimates and missing evidence. For a capacity-effect hypothesis, we ask whether performance fell below a previously sustained baseline, whether the change follows identifiable demand conditions, and whether others exposed to those conditions show the pattern. Without a usable baseline or corroboration, the claim remains limited.
We quantify supported extra effort using person-hours and agreed labor rates. Calendar delay stays separate and is valued only with a defensible financial basis. Each figure records its source, assumptions, range, and confidence. We reconcile overlap across Taxes, separate opportunity scenarios, and identify what could make the cost case wrong.
Phase 4: Agree the Next Action and Measurement Plan
The executive session brings the evidence, supported economics, competing explanations, and available options into one decision. The next action may be an internal fix, a resource or priority decision, a specific evidence step, a bounded Pilot, or stopping or redirecting. If the cause remains unresolved, the Audit identifies what evidence or management decision is needed next, who owns it, and when it will be reviewed. A Pilot recommendation needs a material question, a measurable baseline, an accountable owner, and a change whose prediction can be tested.
A proposed Pilot identifies the primary measurement team, the bounded work route, and the people inside and outside the team who control its decisions, approvals, and handoffs. Their authority and participation must be agreed. The plan also names what existing activity must stop and where people may bypass the change or return to the old routine.
Planning estimates: under 20 minutes per survey participant and roughly 6 hours of leadership time across scoping, interviews, and the executive readout. Confirmed during scoping.
Proposed Deliverables
Lead Deliverable
COO Brief
A single-page brief with the supported operating-loss estimate, separately stated exposures, the findings the evidence supports, capacity-effect hypotheses where relevant, and the next decision. It names the next action, owner, review point, and operating metric when one applies. Built for the executive who has to decide what happens next.
Findings Report
A 30 to 45 page report covering the result and prerequisites, necessary work and ownership, work-demand and priority patterns, work paths, queues, decisions, competing explanations, capacity-effect hypotheses where relevant, and supported economics. It traces prior findings to the new evidence and shows assumptions, confidence levels, gaps, and the next options.
Executive Presentation
A 15 to 20 slide deck delivered in a two-hour working session. Built for the executive team that needs to make investment decisions from the evidence. You keep the deck for internal use.
Data and Calculation Appendix
A privacy-protected appendix documenting source fields, definitions, calculations, assumptions, confidence levels, overlap controls, and the aggregate evidence behind the findings. It does not expose private individual app activity, Zone history, or live state data.
Ranked Decision and Intervention Portfolio
Next-step options ranked by evidence strength, expected value, feasibility, and measurement clarity. The right answer may be a management decision, an evidence step, a straightforward internal correction, or a measured intervention. Each proposed change names an owner, operating standard, metric, target, and review date. A response outside ES remains a valid recommendation.
Pilot Measurement Plan
Where warranted, a proposed Pilot using 12 weeks as a planning assumption, with duration and follow-up timing agreed around the work cycle and evidence needed. The plan defines one primary measurement team, a bounded work route, the cause being tested, baseline, owner, target, and decision rule. It records adoption, other changes that could affect the result, and signs the explanation is wrong. Any capacity-effect prediction is tested separately from direct flow improvement. If a Pilot is not justified, the report gives the reason and next action. No obligation to continue with us.
What a Finding Looks Like
We are in the design partner phase, so there is no client case study we have permission to publish yet. We are not going to invent one. What we can show is what a finding has to contain before we will put it in front of an executive team.
Each finding separates what happened, what explanation the evidence supports, plausible alternatives, the supported economic exposure, and the next decision. For example, records might show an approval queue accounts for most elapsed delay. That would support a work-path finding. A claim that surrounding demand reduced access to judgment or focus would still need separate evidence. Each finding states what would make it wrong and what remains unknown.
The cost case comes from your data and stated assumptions. Forfeited Upside uses opportunities and values supplied by your leadership team and stays separate. A Pilot tests whether the intervention moves the agreed result. Faster flow alone does not prove restored access to skill. No improvement, contradictory evidence, or an inconclusive result must also be reported.
The full sample finding will appear here once the first design partner engagement closes and we have permission to publish.
Who Delivers the Audit
A senior practitioner leads the engagement and is named in the scoping call. Jim Wilde built the ES evidence-first methodology for investigating stalled projects, recurring operational problems, and business results that fall short. He reviews the work, makes the judgment calls on findings that do not fit a clean pattern, and joins the executive readout when it serves the engagement.
For Design Partner engagements, founder involvement is heavier: methodology shaping at kickoff, findings review before delivery, and the executive readout. Once the firm scales past the design partner phase, that level of involvement is no longer part of the standard engagement.
Background on the methodology. Jim Wilde developed the methodology through decades of enterprise systems work, including a nine-year tenure as lead dev/pm on mta.info, the public-facing digital infrastructure for the Metropolitan Transportation Authority. The Five Capacity Taxes are documented in CAPACITY: The Variable No One Measures.
Investment
These tiers are proposed scopes and pricing assumptions. Final fees, duration, and deliverables are confirmed during scoping. A single team or department can be a starting scope.
Team Audit
\$15,000 to \$25,000
Single team, 5 to 15 people. The full methodology scaled to a team-sized engagement. Proposed 3 to 4 week timeline.
Department Audit
\$35,000 to \$55,000
Department or sub-function, 16 to 75 people. Cross-team pattern analysis included. Proposed 5 week timeline.
Function Audit
\$65,000 to \$95,000
Multi-team function or business unit, 75 to 300 people. Strategic-level findings. Proposed 6 to 8 week timeline.
Enterprise Audit
Custom
Multiple functions or a full division, 300+ people. Executive-level scope. Custom timeline and deliverables.
Audit sizing depends on the work and decisions in scope, the number of teams and interfaces involved, evidence access, and the depth of measurement required. Total company headcount alone does not determine the scope.
2026 Design Partner Cohort · Three Slots
Design Partners help refine the Audit.
The first three audits are for leadership teams comfortable helping refine the ES Audit. Design Partners receive founder involvement at key moments, methodology influence, cohort learning, and case-study consideration.
- Founder involvement at key moments: methodology shaping at kickoff, findings review before delivery, and the executive readout.
- Methodology influence: your engagement helps sharpen how the audit works at enterprise scale.
- Cohort learning: quarterly executive briefings on patterns surfacing across the design partner cohort.
- Case-study consideration: only when the evidence, your approval, and confidentiality requirements support publication.
Design Partners receive 15% off the first engagement in addition to the access elements above.
Applications close when the three slots are filled.
Where the Audit fits in the ES system
The Stalled Priority Snapshot investigates one consequential result for a fixed \$1,500. It typically combines input from 6–8 written contributors with a 90-minute working session for up to three participants, a written readout within 24 hours, and a 15-minute walkthrough. The 90 minutes is the working session, not the whole investigation. It resolves the next decision; a bounded test is optional where supported. Follow-up comes after an agreed test or evidence review. No follow-on engagement is required.
The Work Demand Diagnostic examines whether work-path problems, work-demand contributions, or both recur across a team or category of work, while keeping other explanations open. This workshop costs \$3,500 to \$7,500, depending on participant count and half-day or full-day scope. Its findings, assumptions, test results, and unanswered questions can carry into the Audit when deeper measurement is justified.
The Audit builds the deeper operating and economic case and resolves the next decision. The Pilot tests it and checks whether any improvement begins to hold. Where results and continuing need justify it, the proposed License could begin with a connected work group to test whether improvements repeat. Its intended scope includes manager practice, private individual tools, aggregate operating reporting, and executive review, subject to agreement. Each stage is a separate decision. See the full ES system →
Questions
How is the Capacity Audit different from a traditional audit?
A traditional audit usually compares what is happening against a defined standard, policy, control, or requirement. The Capacity Audit starts with an unresolved business result and tests competing explanations for why it is falling short. It can use standards and controls as evidence, but its purpose is to resolve uncertainty about cause and support the next operating decision.
Will my employees feel surveilled?
The Audit is designed to avoid individual surveillance. A capacity survey, when used, is voluntary and privacy-protected. Calendar and flow analysis operate on agreed aggregate patterns and selected work, not persistent monitoring of individual behavior. Managers never receive private app activity, individual Zone history, or live individual-state data. Reporting thresholds and confidentiality rules are set during scoping.
Where does this not work?
The Audit needs a defined unit of work, usable evidence, an executive sponsor, and enough operating stability to act on the findings. A reorganization, leadership change, or systems rollout does not automatically disqualify the work. Those events can amplify drag. When boundaries and decision rights are changing daily, a narrower Snapshot or Diagnostic may be the better first step until a stable scope can be defined.
The method is built for defined units of demanding knowledge work and scales from a single team through multiple departments or functions. In manufacturing, retail, logistics, and other operating environments, it examines the knowledge-worker and decision layer. It is not a replacement for industrial engineering or frontline process-control systems.
How do you separate structural drag, a capacity effect, and a performance problem?
We check the outcome, priority, required capability, information, authority and funding, external dependencies, and whether necessary work was identified and assigned before attributing the problem to a work route. We then examine work-path friction and demand conditions as distinct, sometimes interacting explanations. Baseline shift, a load signature, and shared conditions may justify a capacity-effect hypothesis. Reversibility requires evidence from changed conditions, through an existing documented change or an agreed test. A Pilot is one option; the evidence may support, weaken, or leave that hypothesis unresolved.
A weak capacity finding does not erase a supported work-path finding or prove another cause. We also examine whether a known, workable standard is being followed. Skill gaps, role fit, strategy, incentives, tooling, staffing, or ordinary error may explain more. The Audit names mixed causes, uncertainty, and the limits of ES’s role. It can recommend an ordinary operating fix or a different specialist.
How is this different from an engagement survey?
Engagement surveys primarily measure sentiment and perception. The Audit reconstructs queues, decisions, approvals, rework, and work in progress. It separately examines evidence for a capacity-effect hypothesis and ties supported findings to cost and intervention options. A survey can be one evidence stream, but it does not determine the finding by itself.
If there are five Taxes, is the bottom-line number just the sum?
No. The Five Capacity Taxes overlap. The same meeting, approval queue, or rework loop can appear through more than one lens, so five independent dollar lines would double-count the loss.
Where the evidence permits, the Audit builds a supported operating-loss floor with overlap controls. It separates person-hours from calendar delay and values delay only with a supported financial basis. Recovery Debt needs evidence of a continuing burden affecting reliable execution. Any turnover cost needs separate support. Forfeited Upside remains a separate client-supplied scenario. Every figure carries its assumptions and confidence level; released capacity is not automatically cash savings.
How do you quantify Forfeited Upside without fabricating numbers?
We use specific opportunities your leadership team identifies, relevant pipeline or initiative history, and your own valuation framework. You supply the opportunity value. The Audit can show the work-path and capacity conditions surrounding the missed action, but it does not claim counterfactual certainty. The result is reported separately as a client-supplied scenario or range.
Does the research benchmark apply to our industry?
Not as your number. The 2025 study is a computational model of disengagement and burnout cost under specified U.S. workforce assumptions. It is an adjacent scale reference, not validation of ES and not an industry-specific operating benchmark. The Audit uses your work-path, operating, compensation, workforce, and opportunity evidence.
Can we audit a specific team or function instead of the full organization?
Yes. A single team or function can be the agreed scope. The practical unit is a team, department, function, practice, or business unit where output depends materially on judgment, analysis, decisions, communication, creativity, or complex problem-solving under pressure.
What is required from our IT team?
Usually limited support for agreed aggregate exports or access to existing operating data. Survey distribution can run through existing HR channels. Calendar and flow analysis can use voluntary opt-in tools, aggregate exports, or selected work records. No persistent monitoring, new infrastructure, or live individual-state feed is required.
What if the findings point to leadership behavior or decision rights?
Then the Audit should say so. It can identify observable patterns such as approval concentration, priority churn, escalation habits, unclear authority, or inconsistent sponsorship. Findings are evidence-based and scoped to operating consequences. They do not expose private individual-state data or turn the engagement into a clinical judgment about a person.
Do we have to commit to implementation after the Audit?
No. You own the deliverables and recommendations. The findings may support an internal fix, further investigation, a Pilot with duration and follow-up timing agreed around the work cycle and evidence needed, or stopping or redirecting. A Pilot needs agreed authority, participation, baseline, owner, metric, target, and a testable prediction. If results later justify a License, its agreed scope may include testing whether improvements repeat in a connected work group. There is no obligation to buy the next stage.
Does the Audit require onsite work?
No. Team and Department Audits can be delivered remotely. Interviews, surveys, work-path review, operating-data analysis, and the executive readout can all be completed without onsite work. Onsite sessions are available when the leadership team wants a working session around the findings and redesign options.
Build the evidence for the next decision.
Bring the recurring problem and the evidence you already have: repeated delays, partly delivered priorities, weak adoption, rework, or decisions that keep reopening. If you have a Snapshot readout or Diagnostic summary, we start there. The scoping call determines what deeper investigation and measurement would add.
We will tell you whether an Audit is the right next step. If it is not, we will tell you that too. Kickoff timing is agreed during scoping.
