Operational efficiency and workflow optimization
Operational Efficiency Through Workflow Optimization
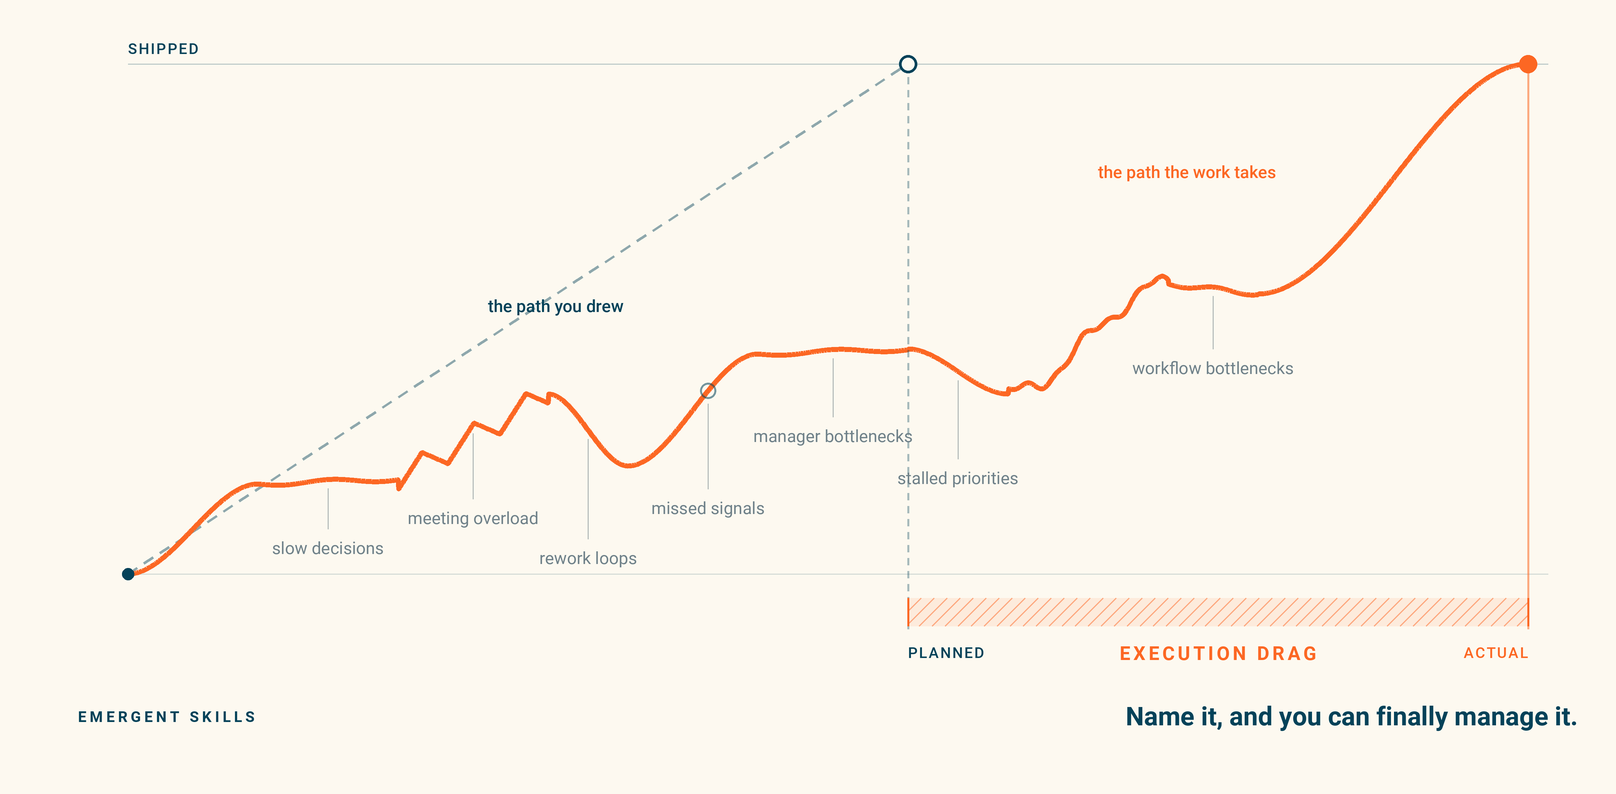
Operational efficiency falls when capable people spend too much time waiting, chasing decisions, reopening completed work, or routing everything through the same overloaded person. Those workflow bottlenecks, delays, and rework loops are evidence of a larger pattern we call execution drag.
In the deck, the evidence appears as cycle time, rework rate, and missed milestones. In the hallway, it sounds like firefighting or "if Sarah is out, this stops." The measures describe the result. The complaints point toward conditions worth investigating.
In Emergent Skills work, execution drag commonly appears through two routes. The work itself gets stuck in the work path. Or the demand conditions around the work reduce reliable access to existing skill. Before blaming the person doing the work, trace where work waits, loops, piles up, or routes through one overloaded person.
A work management platform may show you the queue. The record still has to be examined to establish why the queue moves more slowly than the plan assumes. The condition usually sits upstream of the late status a dashboard reports.
When the pattern concentrates on one stuck deliverable, it has a date and a record you can trace. See why projects fail and what to check first.
Executive SummaryWhat execution drag costs, and how we test for it.+
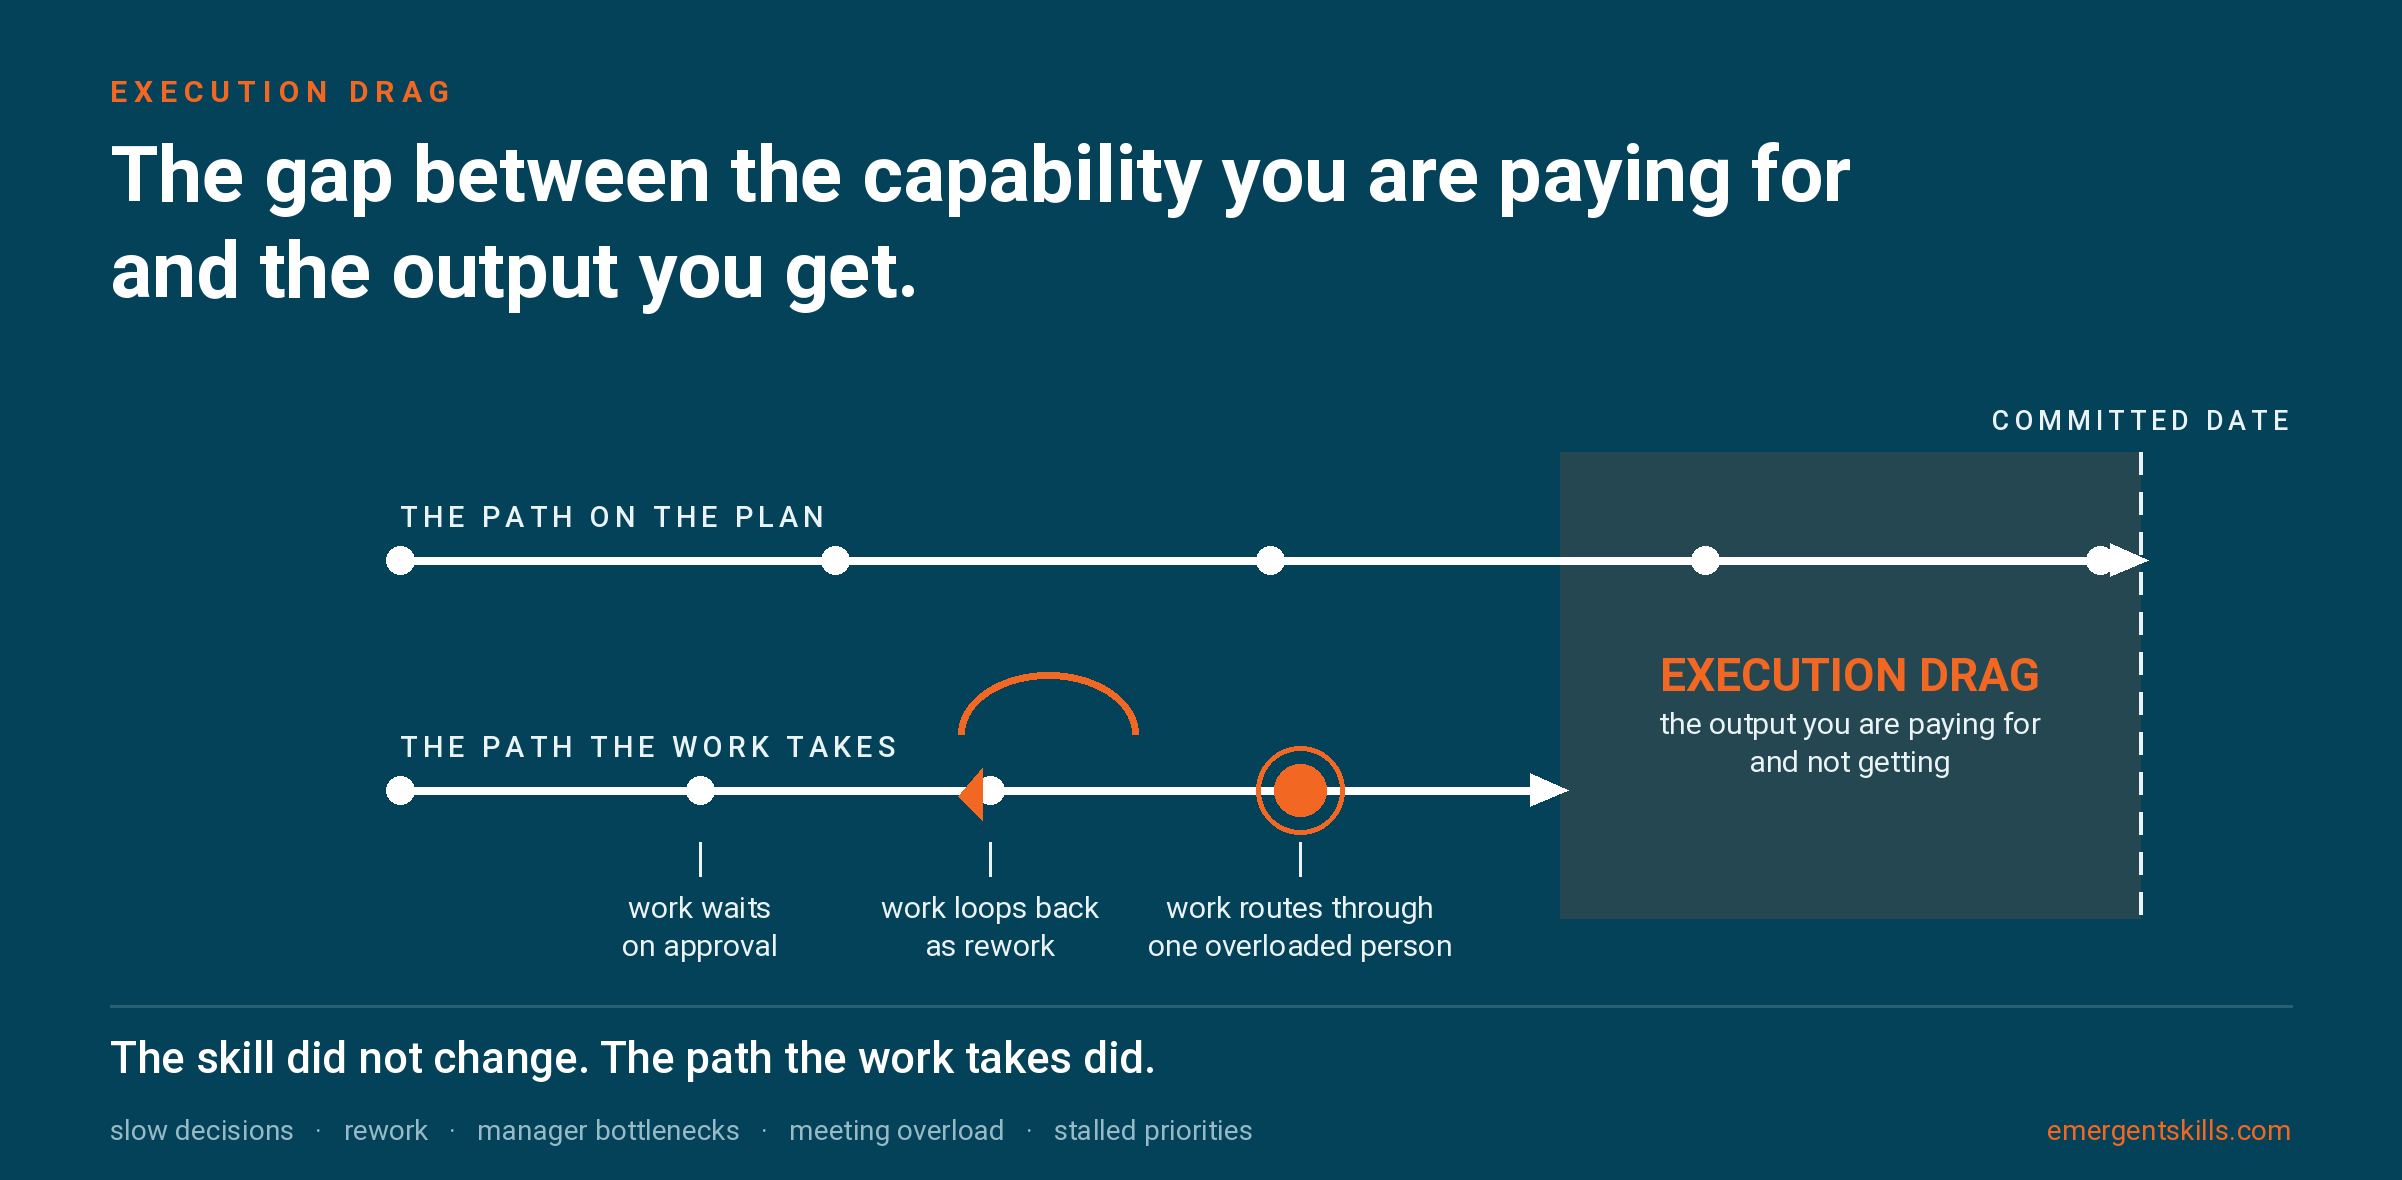
Execution drag is the gap between the capability you are paying for and the output you get. It shows up as slow decisions, rework, fragmented work, workflow bottlenecks, and priorities that never ship. Before treating it as a people problem, trace the work path and test how demand is designed, stacked, and routed.
Most dashboards miss it. They report the late project, the reversed decision, the team that fell behind. They rarely tell you which work-path or demand conditions produced the miss, and by the time the result lands the cost is spent.
Sometimes the work path is enough to explain the problem. An approval sits for two weeks. A handoff fails. You do not need a capacity theory to explain that. The same conditions can also reduce reliable access to existing skill, and the Four Tests apply to that narrower claim.
The cost becomes visible through five overlapping Capacity Taxes: Meeting, Decision Density, Manager Load, Recovery Debt, and Forfeited Upside. They are five lenses on one system, not five buckets to total. Naming them makes the pattern manageable.
Not every miss is drag. A skill gap or role mismatch may be the better explanation, and a bad call by itself proves nothing about demand. A capacity-mediated explanation becomes credible enough to test when three hold: a baseline shift, a load signature, and shared conditions. The fourth, reversibility, cannot be screened from a record. It is settled by changing the condition and measuring the result, which is what the Pilot is for.
The engagement is sequenced. The Execution Drag Calculator produces a directional exposure scenario in under two minutes, from your own headcount and compensation data. The Stalled Priority Snapshot is a $1,500, 90-minute working session on one stuck priority. The Work Demand Diagnostic is the half-day step when the pattern runs past a single priority, and we will tell you when it does.
The operations problem hiding in plain sight
Execution drag
The slow, rough, late output that shows up when capable people are working hard but the work system is fighting them.
Not every execution problem has the same cause. We look first at the path the work takes and the conditions people are working under. You can already see the effects: firefighting, slow decisions, rework loops, broken handoffs, meeting overload, forfeited upside, and workflow bottlenecks. They often get filed under whoever happened to be in the room instead of examined as evidence from the work system. Name the pattern, and you can investigate it. Download the Execution Drag Checklist.
Workflow optimization starts with the symptoms operations teams already recognize.
Nobody opens a laptop and searches for "execution drag." That is consulting vocabulary. They search for the symptom, and they describe it the way it feels on a Tuesday.
Firefighting
"We spend the week putting out fires instead of building the system that would stop them."
Unplanned work has taken priority over planned work often enough that the team has stopped scheduling the planned work at all.
Operational tax
"Every simple change costs three weeks of meetings and approvals."
Work waits on approvals, handoffs, reviews, unclear ownership, or one person who has become the route for everything. The overhead is paid on every request, whether the request is large or small.
Context switching
"My team touches six tools to close out one order."
Tasks are assigned, but meetings, messages, searches, tool crossings, approvals, and changing priorities fragment the path. Progress depends on chasing, checking, and restarting.
Spinning wheels
"Five meetings this week just to align on what we are supposed to build."
Decisions take longer than the work itself because too many decisions stack up too close together, and alignment consumes the capacity meant for execution.
Broken handoffs
"Marketing launches it, Sales sells it, and Ops finds out Monday morning."
Work moves between functions without its context moving with it. Then it comes back, because the requirement was never clear enough to survive the handoff.
Manager bottleneck
"Everything routes through me, and I am the reason it is late."
The strongest manager becomes the point where work slows, not because they are weak, but because too much demand routes through them.
Single point of failure
"If Sarah takes vacation, the whole reconciliation stops."
One person's availability sets the ceiling for a whole process. The risk is visible to everyone and priced by no one.
Priority overload
"Everything is a top priority and nothing has capacity."
New work keeps entering, old work rarely leaves, and too many top priorities compete for the same people, decisions, and uninterrupted time.
Execution drag is the name for the pattern under those symptoms. They can look like separate problems, escalated by different people and filed in different places. When the pattern concentrates on one deliverable, decision, or milestone, it becomes traceable to a date and a work record. See why projects fail and how to find the condition.
Workflow optimization vocabulary
Operational efficiency language, and what each phrase tells you to investigate.
The same condition gets three different names depending on who is in the room. Your team names it in the hallway, you translate it for the deck, and nobody names the condition itself. Here is the translation, and what each phrase tells you to investigate.
The cost gets lost in translation. "We are underwater" does not survive a budget meeting. Cycle time does, but by then you are looking at the result instead of what caused it. The third band is the one you can act on.
How work demand turns into operational efficiency loss.
Sometimes nothing in the process is technically broken, yet too much demand is running through too little usable capacity. That is the path this section traces. Friction in the work path can also produce drag directly, with no change in state required.
Starts here
Work demand design
How much work is active, how fragmented the day becomes, how many decisions stack up, who the work flows through, and whether enough usable capacity remains for consequential work.
It accumulates through ordinary operating choices: recurring meetings, unclear intake, stacked decisions, weak handoffs, and too much open work with too little protected capacity. A reorganization, integration, layoff, system or AI rollout, or new leader can intensify the same path.
Lands on
The state people are in
Put someone through six hours of meetings, twelve decisions, and three competing priorities. They still know how to do the job. Getting to that skill when they need it becomes harder, and the workflow rarely accounts for that.
Changes access to
Existing skill
Judgment, focus, communication, creativity, and pattern recognition remain present, but become harder to access reliably under the current conditions.
Shows as
Execution problems
Slow decision-making, rework, workflow bottlenecks, stalled priorities, uneven performance, and strategy execution problems.
Ends as
Operational efficiency loss
Attrition, redone work, missed signals, delayed growth, forfeited upside, and lost output that may never be itemized on the dashboard.
Direct friction path: work-path constraint → waiting, rework, or delay → operational loss. Change the upstream condition and the downstream metric can move. Manage only the result and the drag repeats.
Business process improvement starts with what to test in the work system.
The left side is what gets blamed on people. The right side is what we check first.
What you see
A strong performer's work turns uneven, quarter over quarter.
What to test in the demand pattern
Test whether meeting overload and context switching are reducing the uninterrupted time and capacity needed for good judgment.
What you see
A decision that should take a week takes six.
What to test in the demand pattern
Test whether consequential decisions concentrate on one saturated manager, and whether delegation or load relief ever changed as the volume grew. The manager's queue then sets the pace for everyone behind it.
What you see
A priority the whole team agreed on never goes live.
What to test in the demand pattern
Test whether work-in-progress overload is crowding out the uninterrupted capacity needed to finish, even though the priority remains agreed.
What you see
Three regional teams run the same process three different ways.
What to test in the work path
Test whether the path was ever specified, or whether each team built its own way around the same constraint. Drift is usually a workaround, not sloppiness.
What you see
A completed proposal waits two weeks for approval.
What to test in the work path
Test whether approval authority, evidence requirements, or review sequence are unclear. The work may be waiting even when individual capacity is intact.
Check the work system before you check the person.
 Why operational efficiency dashboards miss execution drag.
Most dashboards report the result after the cost is spent. Cycle time, rework rate, SLA attainment, and utilization are real measures, and all of them are downstream. They can tell you a project is late, a decision got reversed, or a team is behind. They rarely tell you which work-path or demand conditions produced it.
That is the missing layer. Capacity shows up in individuals, but demand is created by the work system. Look only at the individual and you miss the routing, the meeting load, the decision density, the fragmentation, and the lack of protected capacity that made the miss more likely.
A work management platform will tell you a project is late. It sits downstream of the condition that made it late. The routing, the meeting load, the decision density, the fragmentation, and the lack of protected capacity all happen before the status ever changes color.
Individuals manage their state. Managers manage the demand. We connect the two.
We investigate the connection through a gap analysis: reconstruct the route a priority actually took, separate the work from the waiting, and test whether a demand condition explains the gap before we call it one. The analysis identifies a defensible pattern; the calculator produces a directional cost scenario. See how gap analysis works.
If the evidence points to one constraint, use bottleneck analysis. If the problem has several plausible causes, use root cause analysis. When priorities keep colliding, examine competing priorities before adding more work.
Get the whitepaper: The Hidden P&L Exposure of Work Friction and Reduced Access to Skill
The operational efficiency cost
What execution drag costs, and why it never appears as an overspend.
Drag almost never shows up as money wasted. It was spent on real salaries doing real work. That is why it survives budget review, and why the cost has to be read through lenses rather than found on a line. Five of them, and they overlap, so they are never added together.
Meeting Tax. Meetings, alignment, checking, and status loops that consume production time or defer a decision without producing output. Visible in the calendar.
Decision Density Tax. Consequential decisions stacking too close together, then waiting, escalating, reopening, and returning for cleanup. The same work paid for more than once.
Manager Load Tax. Approval, escalation, and exception handling concentrating through one manager whose own throughput then sets the pace for everyone behind them.
The first three leave evidence in the work itself. Meetings happened. Decisions waited. Work queued behind a manager. Recovery Debt and Forfeited Upside need more evidence than that, so we do not roll them into the same number.
Recovery Debt Tax. Sustained load carried without enough recovery or operating margin. Establishing it takes turnover and longitudinal evidence, not one hard quarter. It is the reason a routing fix can hold and still fail: the people who absorbed the drag are the people the recovery depends on, and they are the ones who leave.
Forfeited Upside Tax. Strategic work, customer signals, and initiatives that never got protected capacity or a viable route to action. Only you can value those, from your own pipeline and your own assumptions, so it stays separate and stays yours.
The taxes show where the loss lands. Traceable operating loss sets the conservative base, with overlap controlled. Elapsed delay is reported on its own.
The cost of leaving it is not the cost of the first miss.
Across 1,471 IT projects, Flyvbjerg and Budzier found an average cost overrun of 27%. The average is close to useless on its own, and they say so: one project in six ran 200% over cost and nearly 70% over schedule. A larger sample of 5,392 projects established the shape behind it, a power law with a fat tail rather than a normal distribution. Why your IT project may be riskier than you think and the power-law finding
Overruns that size rarely have one cause. Scope changes, estimation error, and technical failure all show up in that tail, and any of them can be the larger share. Repeated waiting belongs on the list, and it is the one least likely to be priced, because the calendar keeps running and the cost of the standing organization accrues against work that is not advancing. Most projects land near budget. A minority go somewhere unrecognizable. Part of what separates them is whether the conditions producing repeated waiting were ever changed.
So read an unaddressed condition as an early position in that distribution. On one stalled outcome the cost is the labor plus the calendar. Across an operation, on conditions nobody has changed, it is the tail. How a stall is traced on a single outcome.
How we test whether capacity loss is contributing to execution drag.
Queues, broken handoffs, approval loops, rework, unclear decision rights, and too much work in progress can establish structural drag directly. The Four Tests answer a narrower question: are those conditions also reducing access to existing skill? Baseline shift, load signature, and shared conditions establish whether that explanation is credible enough to test. The Pilot tests reversibility by changing the relevant demand or flow condition and measuring whether the operating metric improves without replacing the people.
The work path is not always the problem. The strategy may be wrong, or the role may be a poor fit, or the team may need a skill it does not have. Other times the drag is real and the fix is not ours: tooling, staffing levels, incentive design, and external dependencies. A bad call by itself is not evidence of a demand problem.
Something runs before the Four Tests. On a single stuck outcome, five gates screen whether the outcome is traceable at all, or whether it is a strategy, specification, resourcing, or external problem wearing a stall's clothes. The trace then establishes the work-path route on its own evidence. The Four Tests apply only to the second route, the claim that demand conditions have also reduced reliable access to existing skill. Most Snapshots do not need that claim, and we say so when they do not.
If the honest answer is "buy a tool," "consolidate three tools," or "hire an integration specialist," that is a real fix and it is not ours. Tool sprawl enters our scope only as fragmentation of the work path and the attention it costs to cross. We say so in the first hour rather than the fourth month.
01 Baseline shift
Capable people are performing below a level they sustained over time. A short peak maintained through excessive effort is not treated as the baseline.
02 Load signature
Errors, reversals, rework, or delays cluster under identifiable demand conditions such as stacked decisions, meeting-loaded days, and context switching. Calendar and workflow data help test the pattern.
03 Shared conditions
Multiple capable people exposed to the same work design show a similar pattern. A shared pattern strengthens the case for a design question. An isolated pattern requires individual diagnosis.
04 Reversibility
The capacity hypothesis makes a testable prediction: change the demand pattern and the operating metric should improve without replacing the people. The Pilot tests that prediction.
The first three establish a credible hypothesis. The Pilot tests reversibility. Work-path friction never needs these four, because it is established directly from the record. A no from us is worth as much as a yes.
The operating pressures behind execution drag are already visible.
PMI found that 35% of executives identified the disconnect between planning and execution as the leading barrier to reinvention, and only half of projects met its value-based definition of success. Findings like these show that the conditions are widespread: demand-capacity gaps, fragmented work, and declining manager engagement. They cannot tell us what is happening inside your team. Your own work record and the Four Tests have to do that.
Figures reproduced from the linked sources as external context.
Model the exposure. Three inputs, your own headcount and compensation data, and a directional scenario in under two minutes.
Improve operational efficiency by changing one condition.
You pay it once in the approval loop and again in the rework it did not prevent. Firefighting is not a discipline problem, and it does not end with another status meeting. It ends when you can see the path the work takes and change one condition on it.
Tell us what you are seeing: firefighting, slow decisions, rework, a manager bottleneck, meeting overload, a workflow bottleneck, or a priority that will not ship. The usual first step is a $1,500, 90-minute Stalled Priority Snapshot on one stuck priority. We reconstruct the actual path, identify the strongest observable work-path pattern, put a conservative number on the hours you can defend, and design one 14-day routing experiment. It produces a credible local routing hypothesis, not a measured outcome. If the pattern extends beyond one priority, the Work Demand Diagnostic is the next step.
